Background
Social media has become an integral part of our everyday life. Users are sharing their day-to-day activities including their experiences that are associated with recent purchases or visits to stores on different social media platforms such as on "Twitter", "Instagram" and "Facebook"...etc. Hence, many forward-looking brands and retailers have been invested heavily in the past few years on collecting social media related data and extracting useful insights from it.
Among various social media, Twitter tells us what's happening in the world now. Users are sharing their instant thoughts and opinions based on different subject matters. On the other hand, users of Instagram and Facebook are mostly describing incidents that had happened in the past.
On twitter, there could be tens of thousands of tweets generated by its users in every second, and we refer to this type of data as Streaming Data
Approach
As a result of this data nature, we want to use advanced analytical tools to deal with this type of data.
In this project, I used Kinesis Data Stream to collect real-time twitter tweets and saved it to my local computers then I processed and analyzed the data using Python.
This kind of hybrid approach combines with both cloud and traditional analytical tools work best for individuals and teams who want to advance analytical power by collecting data from a new data source while analyzing the data using existing tools and rules.
In the project architecture graph shown below in the next section. "Approach 1" is what we just discussed. I will demonstrate how to use "Approach 2" to work on big data technologies such as "Hadoop" and "Spark" in a separate blog.
Project Architecture
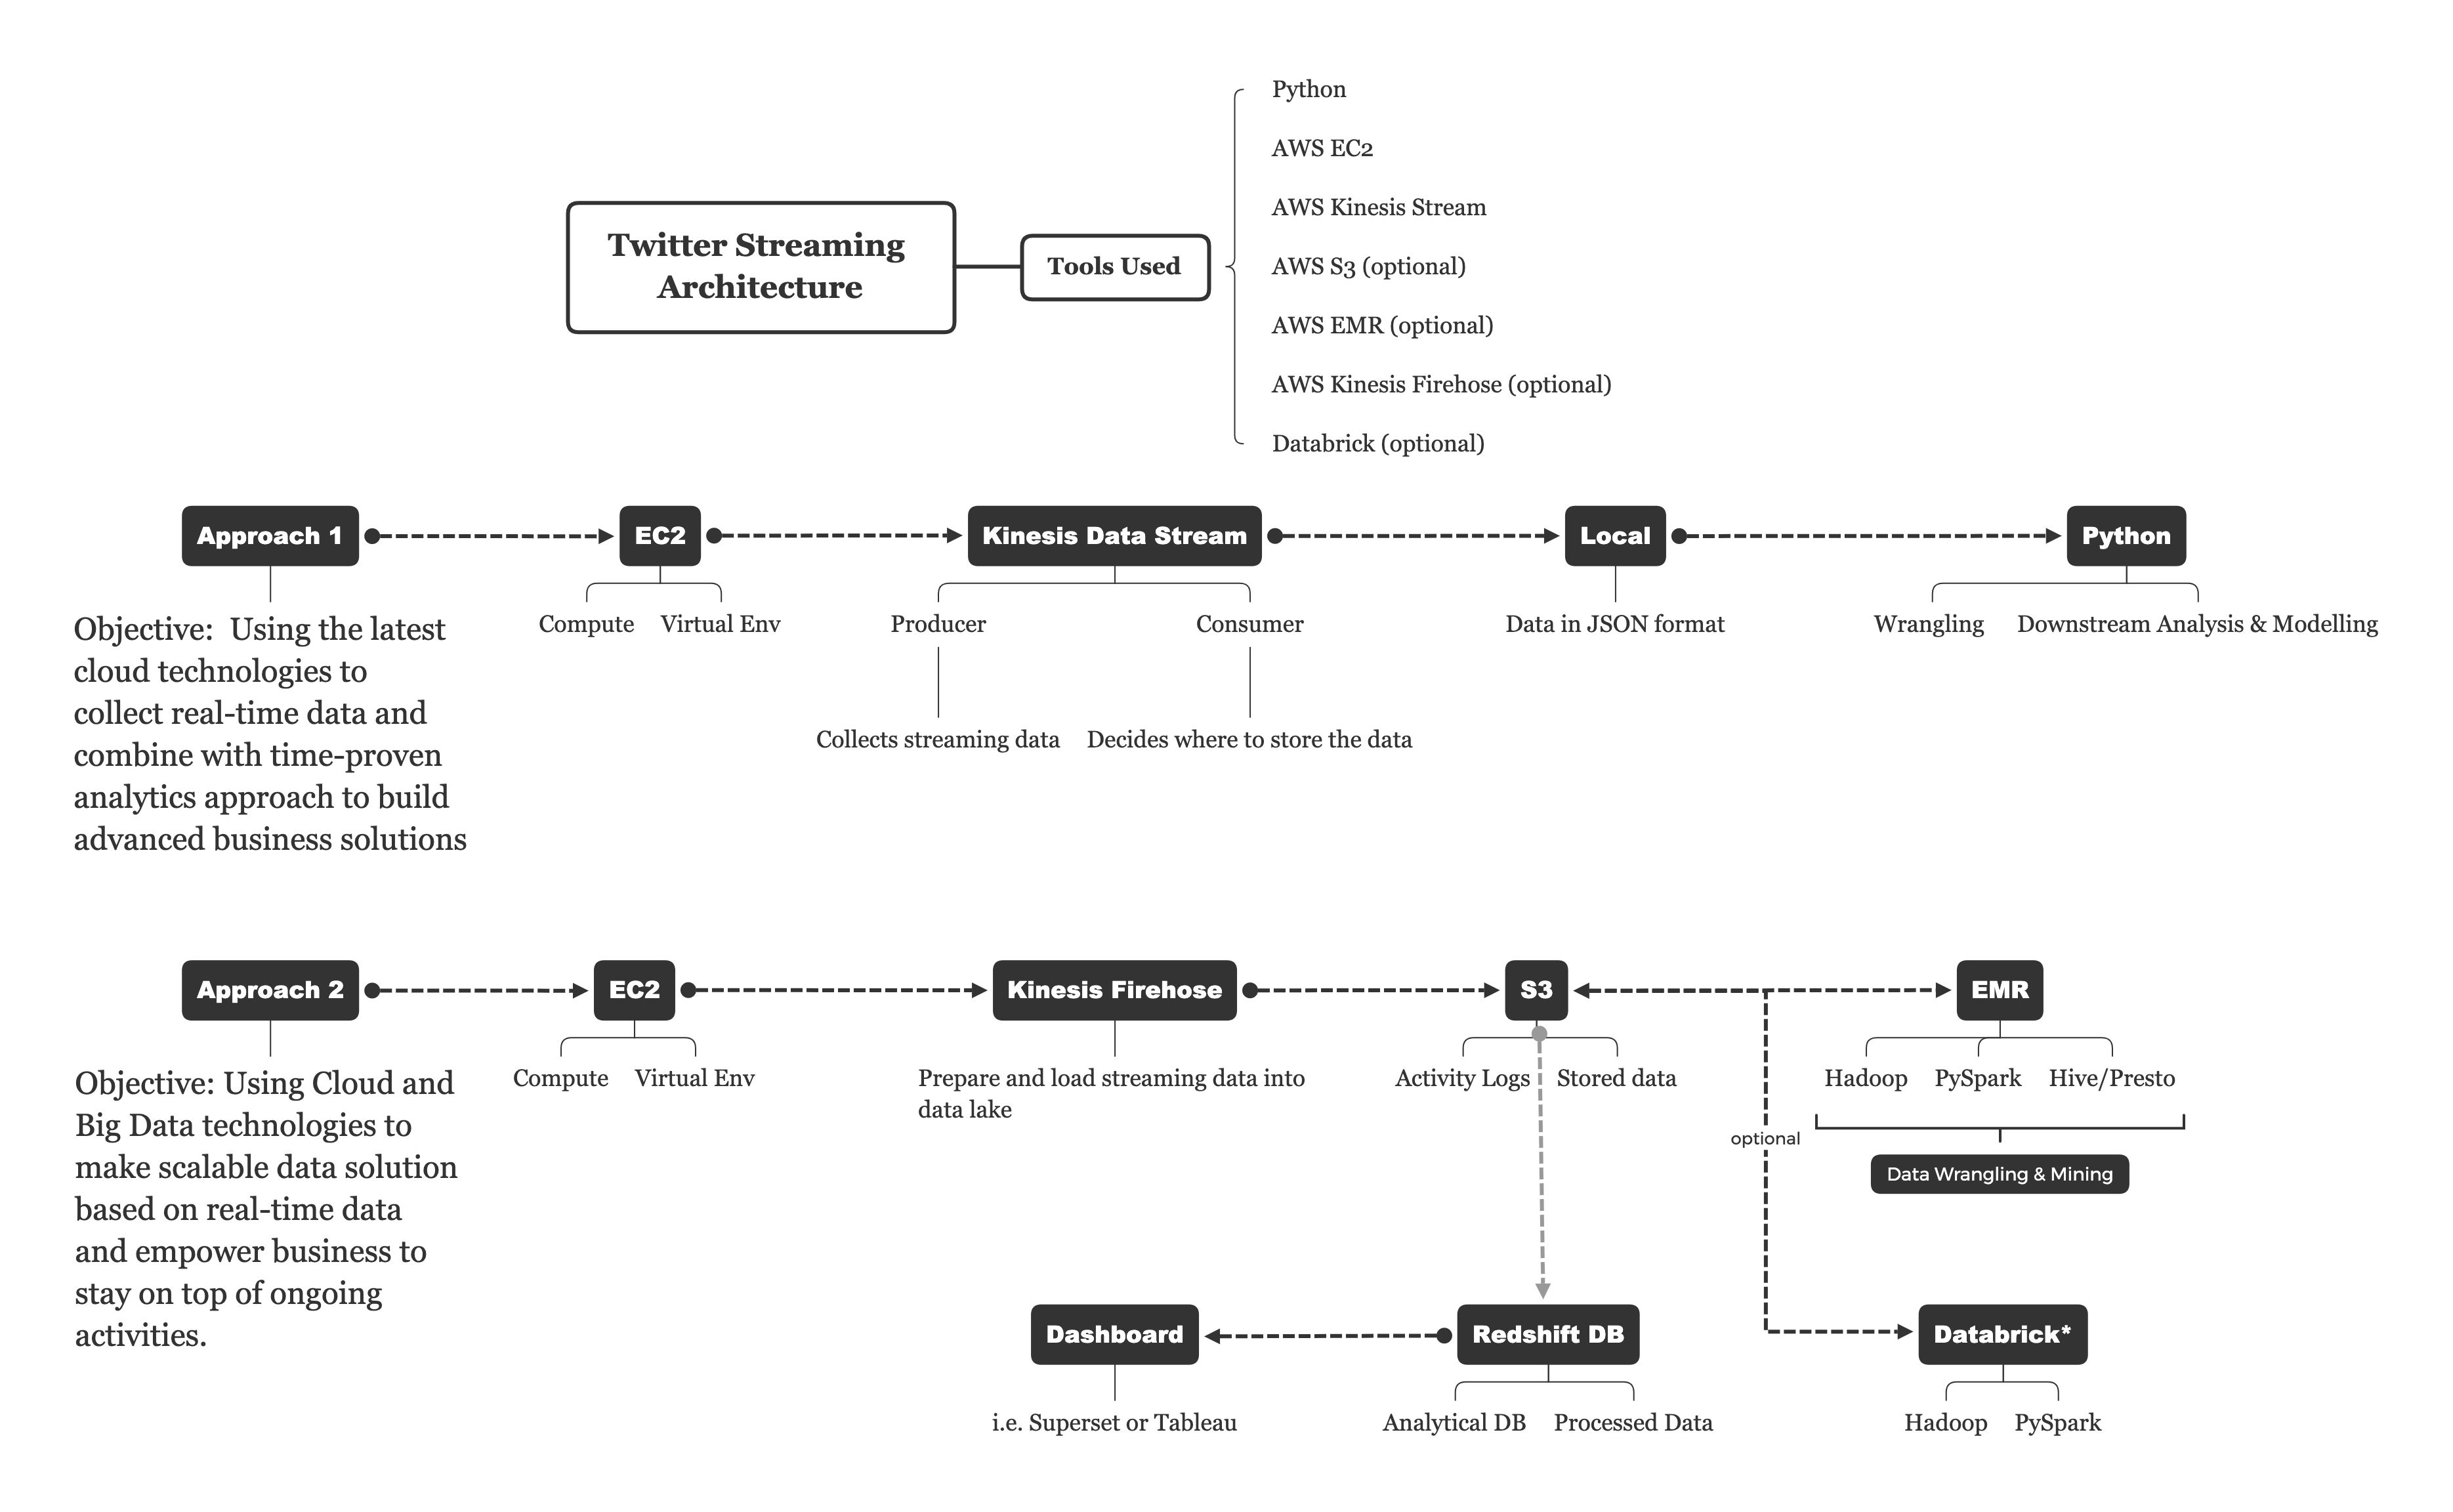
Purpose of this demo
The purpose of this project is to show you how to work with streaming data using AWS managed services and subsequently what kind of insights are we able to extract from the collected data.
I will not be showing the programming and set-up details here.
Part 1 - Getting the data
Step 1: Start an EC2
EC2 is a web service offered by AWS to give the user the compute power in the cloud
We can use "boto3" which is the AWS SDK for Python to start an instance programmatically. Alternatively, we can log into the website and use the AWS management console to set up and start an instance.
It takes time for an EC2 instance begins to work, and once it's ready, you will see something like below:

Step 2: Start a Kinesis Data Stream
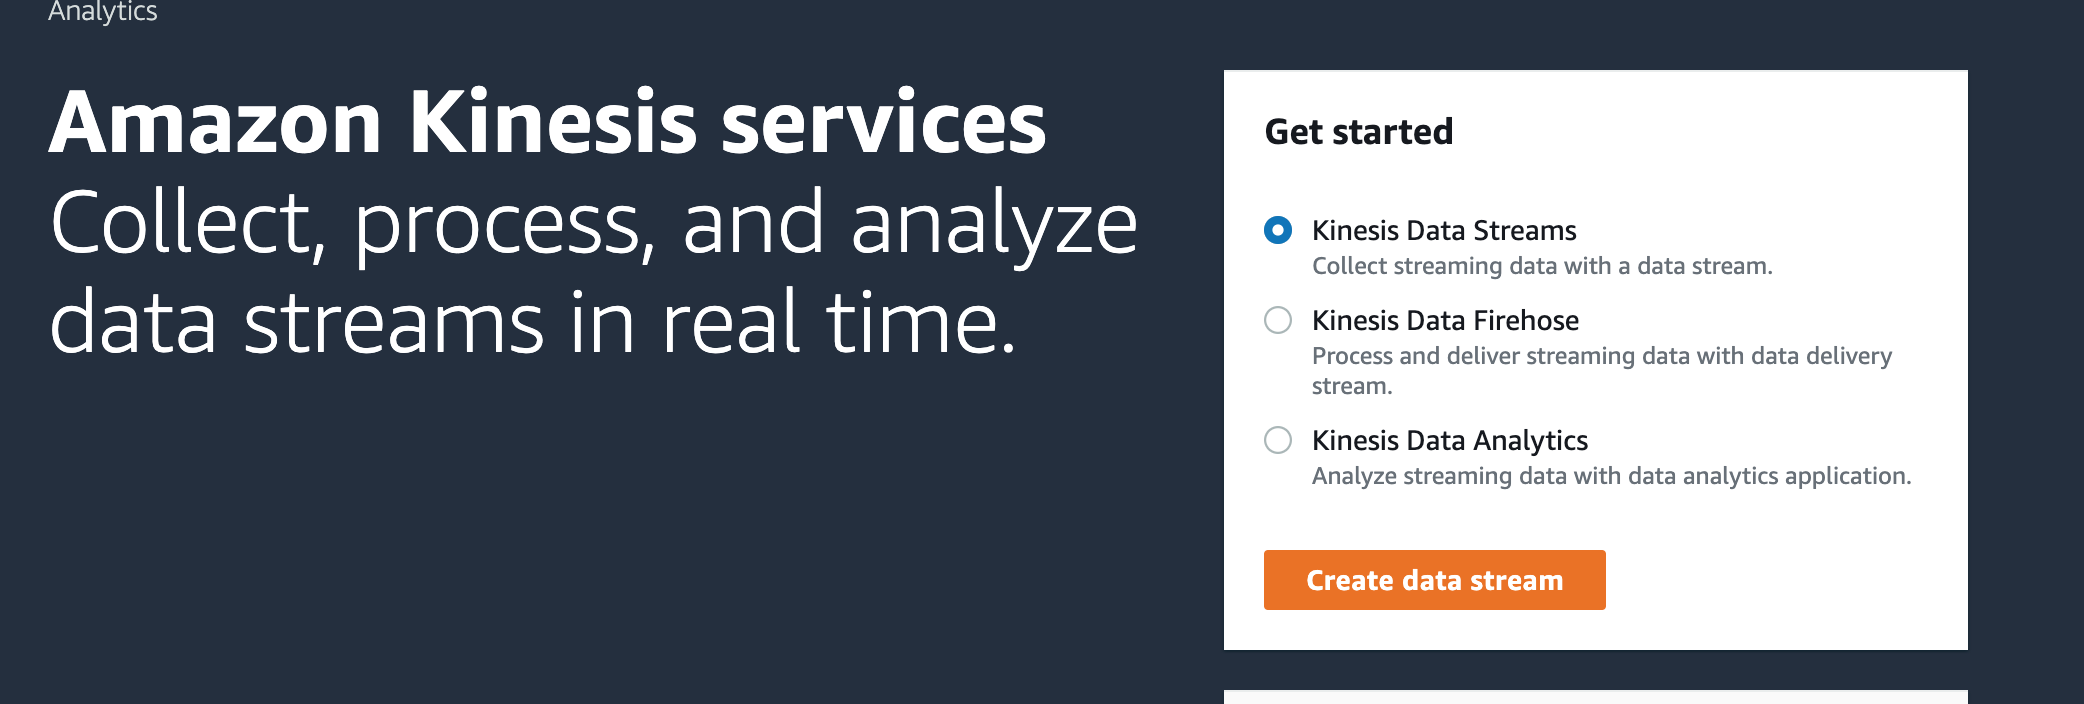
We will be using Kinesis Data Stream in this case to collect and store our target data
Kinesis Data Stream can be divided into two parts: "producer" which responsible for collecting streaming data, "consumer" decides how and where to store the collected data. Note, by using the "producer" alone, the data is not saved.
Alternatively, if you want to save the data directly to a data lake or consume by the analytical tool, you can choose the second option which is "Kinesis Data Firehose". Especially, if you want to store the data in AWS managed storage system, then it is very convenient to set up.
The detailed comparison between the two can be found in this link What I found from practice is that Kinesis Data Stream is a lot more flexible and it supports many consumers to one producer which make it ideal to build customizable solutions for different needs.
Step 3: Establish Connection and Set Up Environment
The first thing we want to do is to create a secure connection between our local computer to the EC2 instance we just created.
We use the "SSH" command to achieve this."
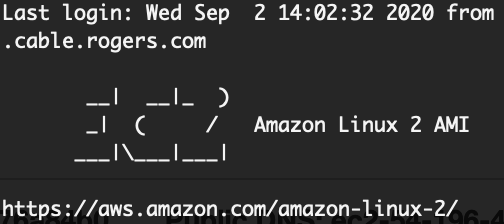
Now, we are in, it's time to install Python3 and other necessary packages. AWS CLI is pre-installed which gives us the power to control the actions in EC2 through our terminal. (note: only python2 is pre-installed in EC2 at the beginning)


Step 4: Copy our "Producer" file to the EC2 environment
We are copying a pre-drafted Python script that defines the actions of the "Producer" to our EC2 environment.
The script calls a connection to Kinesis and uses a Python library called "Tweepy" for accessing and communicating with twitter streaming API which allows us to collect twitter data in real-time.

Target Data
For demonstration purpose, I decided to collect tweets about U.S President Donald Trump and I used the keyword "Trump" to search for any mentions.
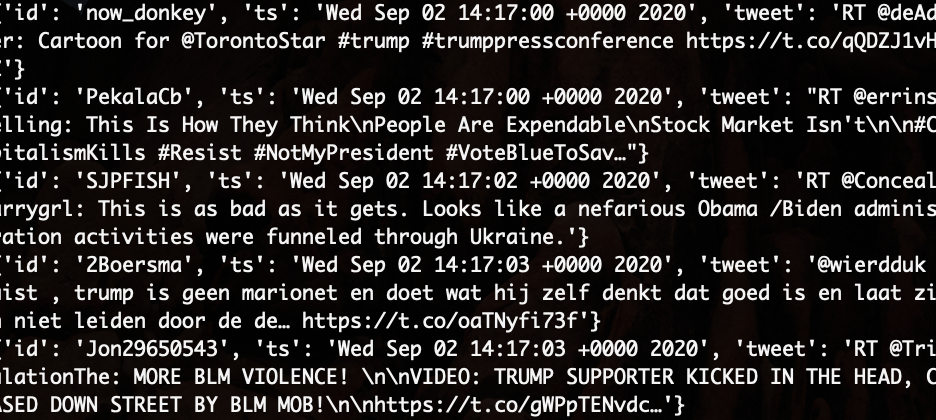
Step 5: Run the script and start ingesting data to the data stream
Step 6: Use "Consumer" to save data to our local computer
"Consumer" is another pre-drafted Python script. It includes setting a connection with Kinesis using boto3 and continuously getting the tweets from the data stream and lastly save the data to the local directory.
This time we are running this script in our local environment:

Now, this is what we obtain: on the left-hand side, the target twitter tweets are being ingested into Kinesis data stream in real-time, and on the right-hand side, we are saving the data to our local directory.

Let's check out our data files
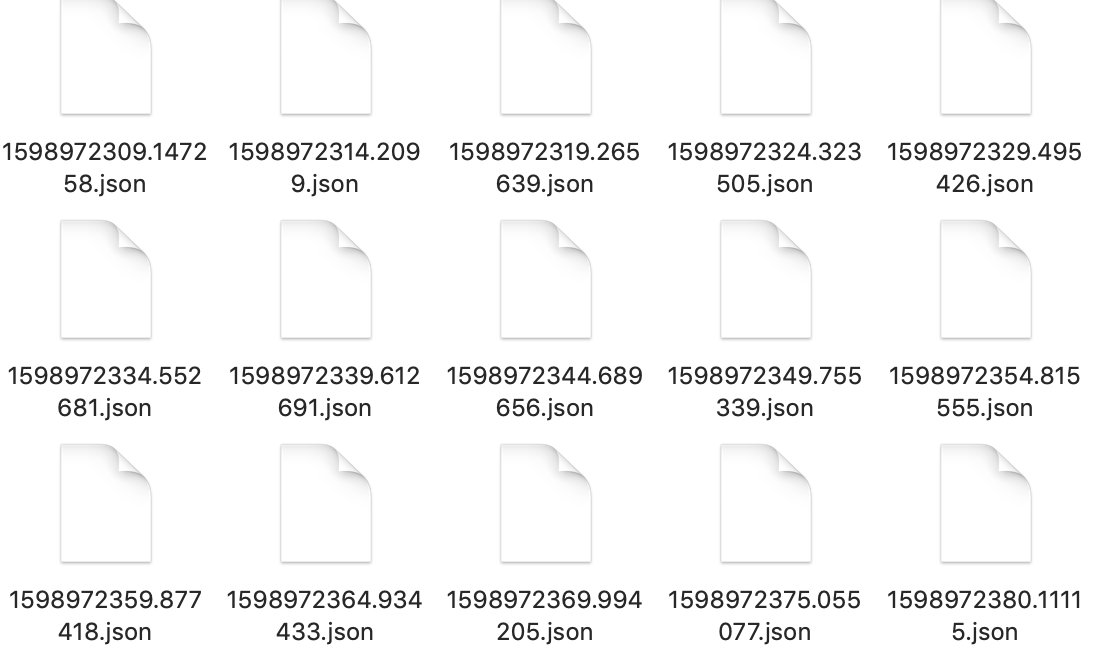
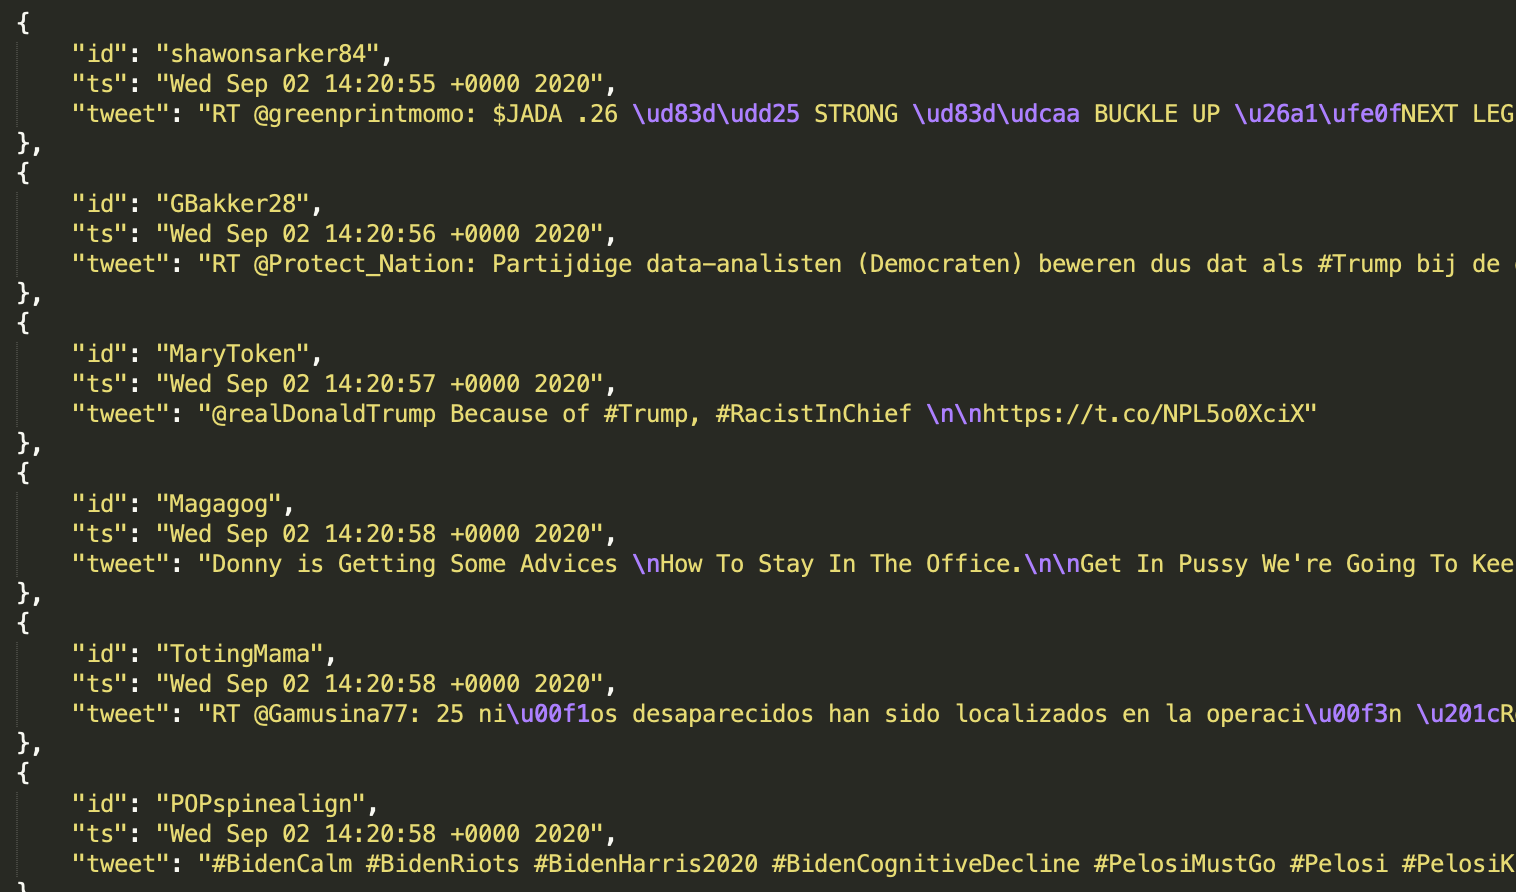
I let the data files to be saved in JSON format to a folder in my computer. It's a folder of JSON files which saves all the tweets about "Trump" during the time we collect them. Let's open one and take a look:
Part II - Making senses of the data
Now the data has been successfully collected to our local environment and we can use any traditional analytical approach to process and analyze the data.
Objective
We are going to apply various text cleaning and transformation technique to turn raw tweets into useful business insights.
Step 1: Load it into Python Pandas Data Frame
With a simple pd.read_json, we can load the data into a Pandas DataFrame. Note: all the Emojis are preserved because they provide additional information and are useful in our case.

Now, we want to load all JSON files which contains our tweets into the same DataFrame, and we can achieve this using a pd.concat. Now, this is what our final dataframe looks like:
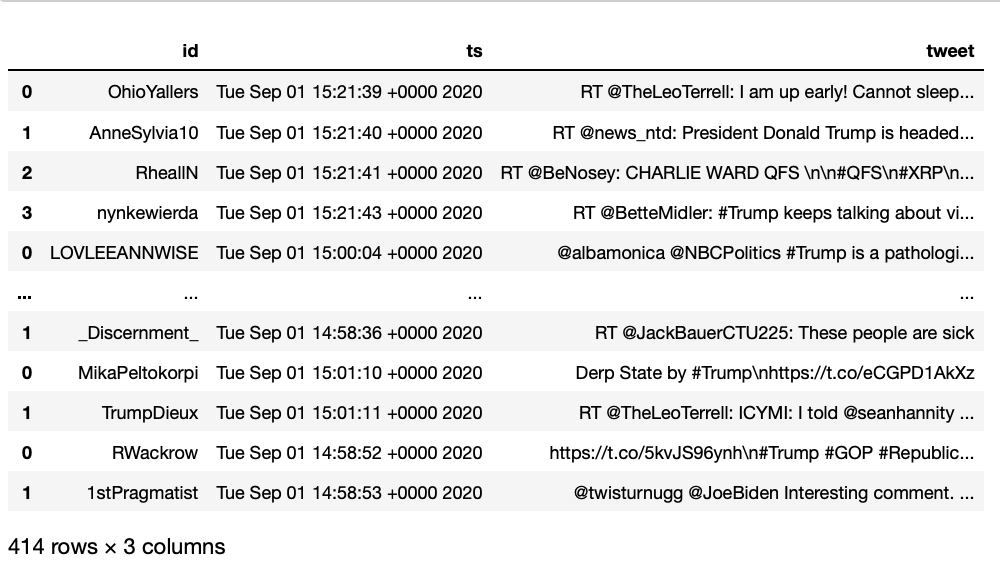
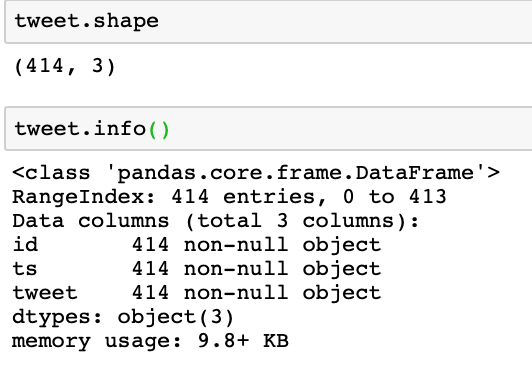
We collected 414 tweets about "Trump" in about 23 minutes of collecting data. Another reason for choosing "Trump" as an example to demonstrate our case is that he's been considered as one of the most active figures on Twitter, so we are confident to get a decent amount of tweets related to him in a relatively short amount of time.
We need to keep in mind that we are paying for the AWS managed services, so cost is another important factor that we cannot simply ignore when setting up the project and data strategy.
Step 2: Capture the important topics using Word Cloud
One of the main goals of social media monitoring is to understand what's been discussed around the topic of our interests.
We can use a word cloud graph to show the occurrence count of important terms.
Text Data Cleaning
I will be using a UDF to clean all tweets and the steps are in below:
- Removing non-alphanumeric characters
- Lowercase
- Lemmatizing
- Tokenizing
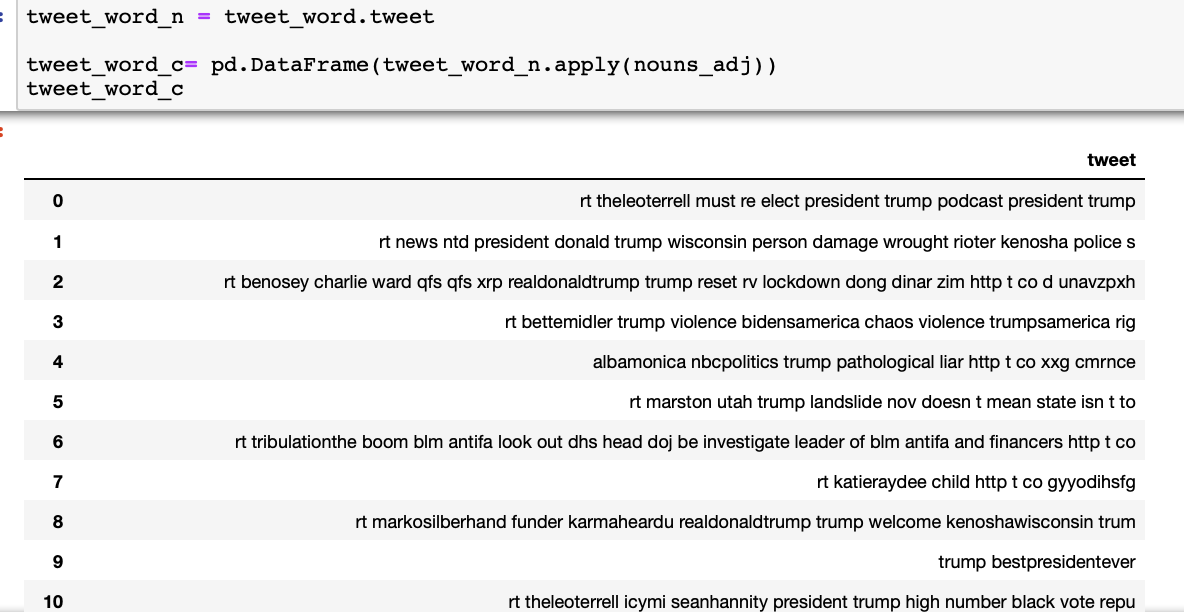
- Use Part-of-Speech tags to extract only "nouns" and "adjectives"
After applying the function to our target tweets, this is what we obtain:
Transform into BoW model
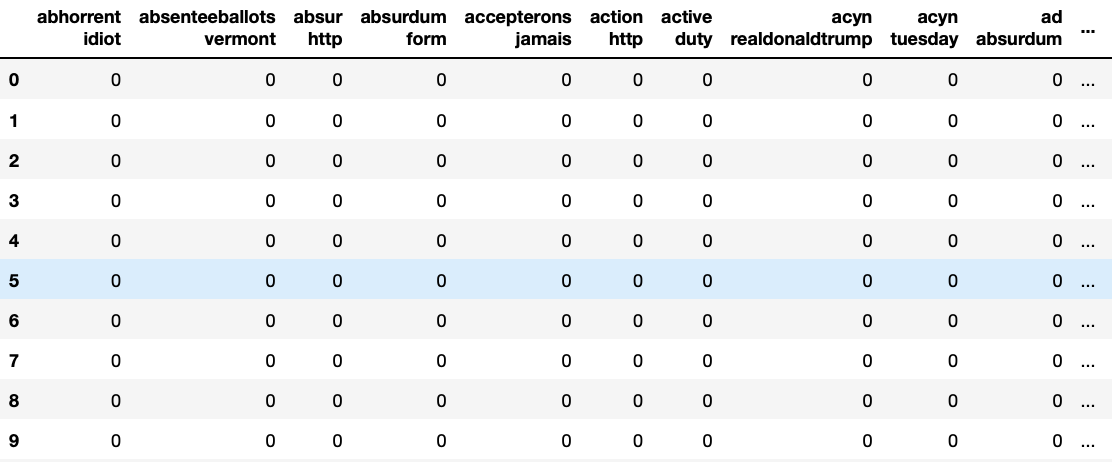
Now, we will transform this series of tweets into its bag-of-words representation.
From here, we get a document-term matrix where each row is a unique tweet, and the columns are made up by all terms/words that can be found in the entire document also known as the vocabulary. The BoW model is like a histogram of words within a text.
This is what we get:
Word Cloud
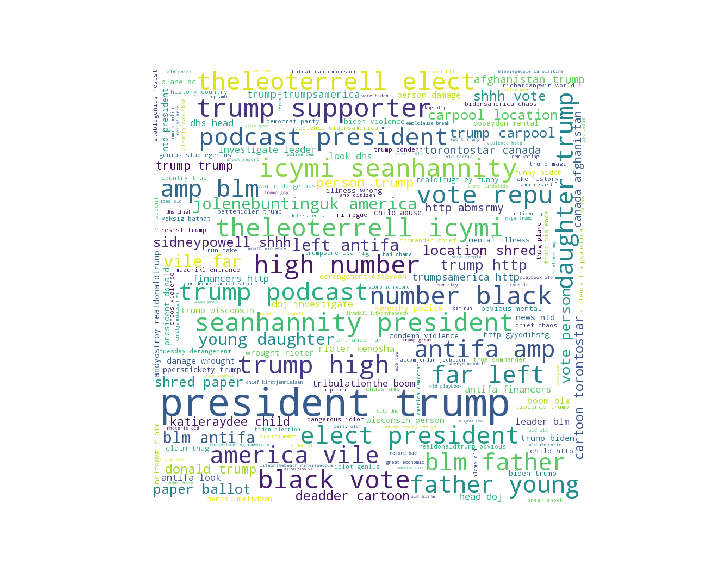
The rest is simple, we import the wordcloud package and call the WorldCloud function to display our graph:
Findings
We see terms like "elect", "elect president", "black votes" which tells us the most of the tweets are associated or some-what related to U.S Presidential Election.
People are tweeting about "Podcast" and we also spot TV and podcast show hosts like "Leo Terrell" and "Sean Hannity". Those people are associated with Trump because they probably talk about "Trump" in their shows, or their recent activities are associated with "Trump".
There are internet slangs like "icymi" which stands for "in case you miss it" appear in the graph, and we can add it to the "stop_words" list thus excluding them from the result.
More
We can derive more useful information if we do additional research based on the top occurrence keywords shown in the word cloud.
For example, after some Googling, I found out that "Leo Terrell", who is a civil right attorney and also a prominent Democrat turned Trump supporter recently joined the TV show called "Hannity Show" which is hosted by "Sean Hannity". In this show, he explained the reason why "Trump" will gain "black votes".
Step 3: Sentiment Analysis
Now, we know what's been discussed, we want to find out the emotions behind those tweets. In the business world, Sentiment analysis can help a business quickly understand what their customers’ opinion towards them. When people mentioning you, are they happy or sad?
Tools
For this particular task, I'm going to use a Lexicon and rule-based based sentiment analysis tool called "VADER-Sentiment".
Based on the official documentation: Each of the words in the lexicon is rated as to whether it is positive or negative, and in many cases, how positive or negative.
Therefore, how it works is when VADER analyze a piece of text it checks to see if any of the words in the text are present in the lexicon. For more details about "VADER Sentiment Analysis" tool, you can check one of my previous blogs.
Why this tool?
According to the team who built this tool, it is specifically attuned to sentiments expressed in social media and it even recognizes Emoji which makes it ideal for analyzing tweets.
Results
We will skip the steps on how to initiate and feed the data to the model, and let's look at the result.

Vader model produces 4 different scores: "negative", "neutral", "positive" and "compound". The first three scores represent the proportion of text that falls in these three categories.
The "compound" score, according to the official documentation, is the most useful metric if you want a single unidimensional measure of the sentiment of a given sentence. How it is calculated is outside the scope of this project, but if you are interested, you can visit its official documentation. What we need to know is "compound" scores are between -1 (most extreme negative) and +1 (most extreme positive). Hence, to interpret the sentiment result for our first review:
It means that our first review was rated as 0% negative, 100% neutral and 0% positive, and based on its compound score of 0, it is a neutral sentiment text.
How do we evaluate this model?
Unfortunately, the data has no labels and we don't have a pre-trained model to help us measure and compare the performance of this approach.
All we can do now is to find the tweet, and read it and decide if the result is correct or not.

However, if we are a company that decides to investing and using social media monitoring, we could hire experts to hand label the tweets we collected so far, and then we can turn this into a multi-class text classification problem.
What's next?
We can add the VADER prediction labels back to the original dataframe. From here, we can do all sorts of time-series analyses such as monitoring the changes in sentiment over different time intervals.
Another use-case for the business can be building a dashboard to show customer's opinion change regarding our product in real-time. This way, we can link various things like our marketing events or company news with the social media sentiments to give us a different view of the market response and perhaps a valuable one.
