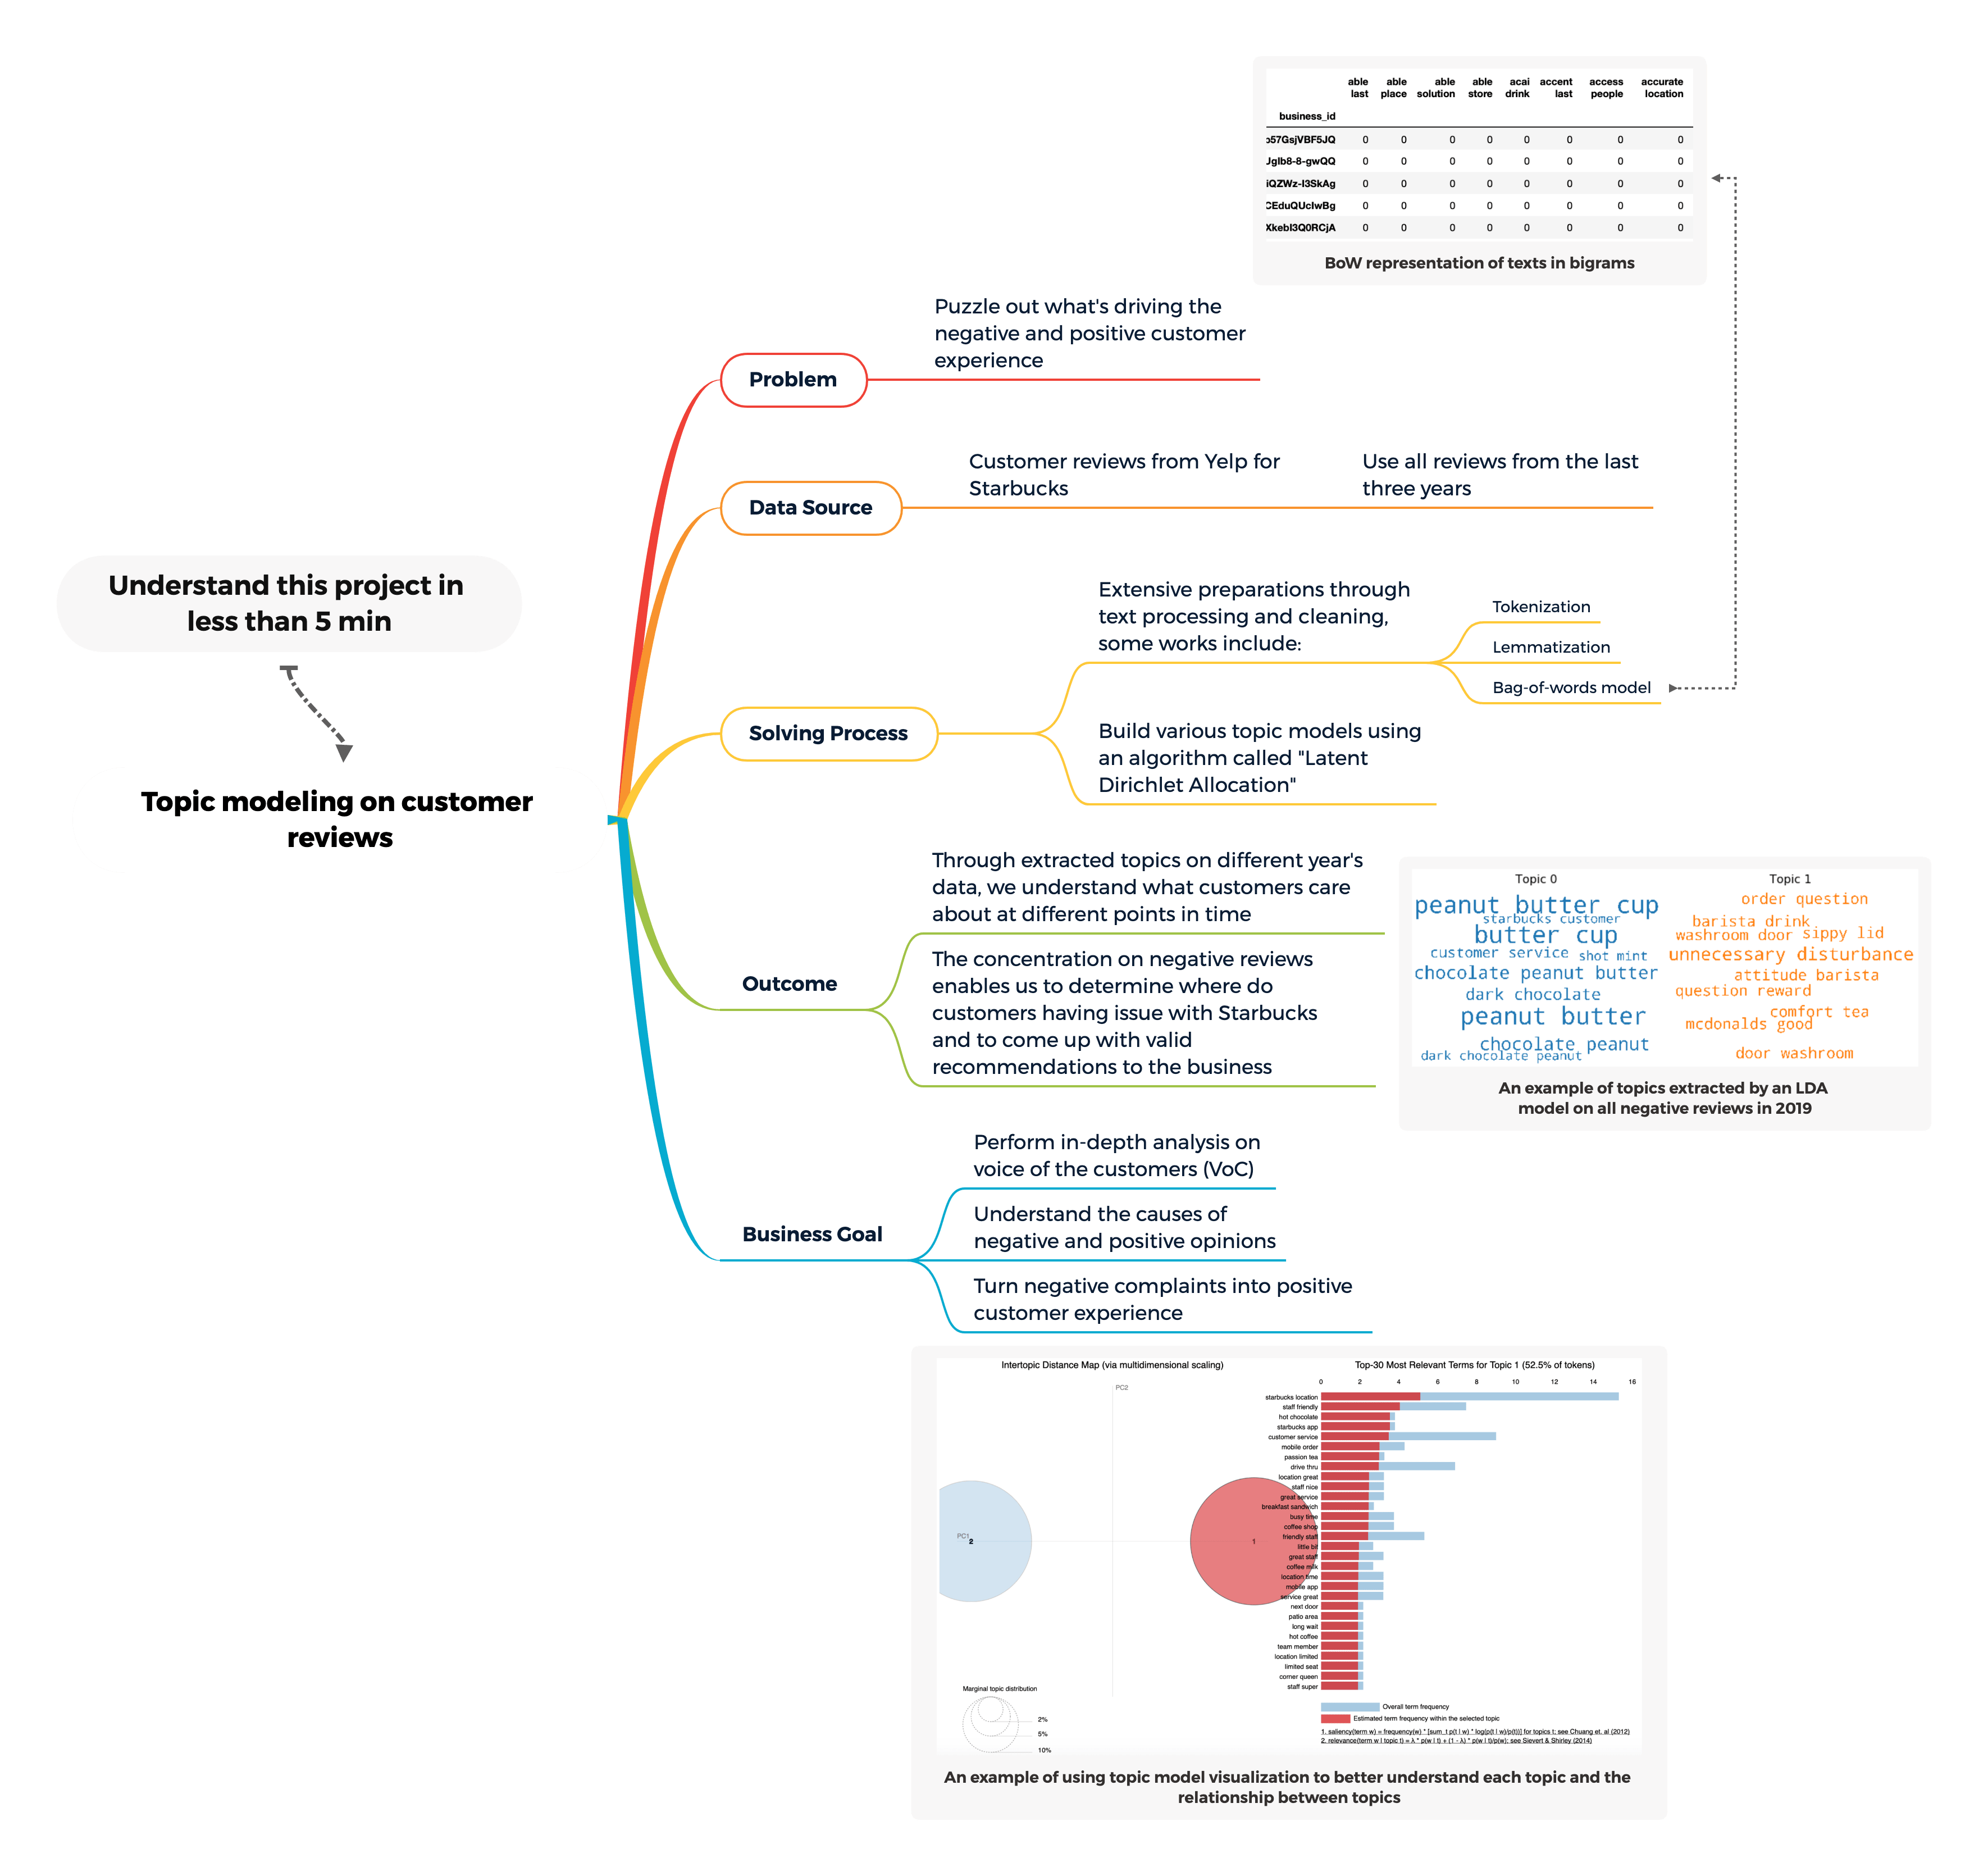
Understand this project in one pic:
Recap from part I:
In the previous project summary, we walked through how to build sentiment prediction models from scratch using three different approaches: "Vader", "Textblob" and our own "Random Forest" model. The first two are open-sourced pre-built sentiment prediction tools and require no training data from us thus can be implemented directly on our data. The random forest model is built by us by teaching the model to differentiate between negative and positive sentiments using existing labels in our data. One of the drawbacks we have noticed with sentiment predictions is, you cannot expect a 100% accuracy as detecting "true" emotions from plain text is a very difficult task and most of the time, you encounter texts that have a mixture of emotions.
Overview for part II:
Businesses can leverage sentiment prediction and analysis to quickly recognize customers' satisfaction towards their products, services and even the business overall. Some advantages of sentiment analysis are it is fast to implement, scalable to large data, and also it is very effective for businesses to capture changes in customer experience and market demand altogether.
However, sentiment analysis also has its limits. For example, acknowledging that customers are not happy without having clues of why they are not happy is meaningless. Topic modelling can be a powerful key to help businesses truly understand what's driving the negative and positive customer experience.
Objective:
In this part II of the use-case demo, I will demonstrate how to build topic models from scratch using Yelp reviews for Starbucks. The results from each topic model will help us understand what customers care about at a given time. I will breakdown the analyses based on years thus we can compare the topics change within customer reviews over time.
Furthermore, we are going to focus on all the negative reviews to find the underlying issues or problems that customers have with Starbucks and to see if we can provide any valid recommendations to Starbucks.
Methodologies & Challenges:
To better understand customers' opinions and complaints toward Starbucks, I am going to apply topic modelling technique on their store reviews from Yelp. By definition, "Topic Modeling is a technique to extract the hidden topics from large volumes of text.", and a good topic model can create meaningful, well-separate topics.
One challenge we foresee is that almost all reviews will be a mixture of topics. Customers are mostly like reviewing their experiences based on the following topics:
1: Location (i.e. Is it a busy location? Is it easy to find?)
2: Service (i.e. How was he/she got treated by the employee? How fast is the preparation?)
3: Product (i.e. Does it taste good or as expected?)
Every review has a mix of above 3 topics to some degree, and it very rare to see a customer exclusively only talking about one topic. We will talk more about this when we see the actual problem.
Lastly, the algorithm we relied on to build topic models are called Latent Dirichlet Allocation (short for "LDA"), and we are going to implement it through a popular Python package called "Gensim".
Solving Process:
The work process includes text cleaning, preparation, using part-of-speech to extract words with identical grammatical properties, searching the best number of topics and lastly demystifying each new topic found by the topic models.
Tools Used:
Language: Python
Packages: Scikit-Learn, NLTK, Gensim, Pandas, Scipy…etc.
Part II begins
Part II begins:
Getting the data:
From part I of the project summary, we split the review data based on years they belong and then save the recent three years of review data individually into CSV files in our local computer. Now, we are using three years review data for Starbucks and load them into separate Pandas data frames

What "review_2019" looks like: there are 146 reviews in total

What "review_2018" looks like: there are 248 reviews in total

What "review_2017" looks like: there are 207 reviews.

Building a customized function for text cleaning and transformation
(1) First, define our Lemmatization function:
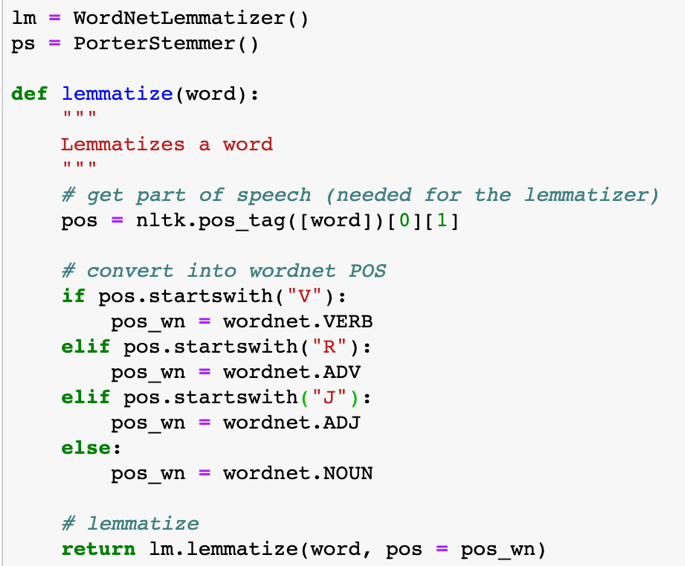
We use "POS" short for "part of speech" to identify each word in a sentence to specifically lemmatizing the word. The if-else statement helps to determine whether each word is a "Verb" or an "Adjective" or an "Adverb" or a "Noun" and assign the corresponding tags. The reason to do this is by default "WordNetLemmatizer" class treats all input words as nouns when you don't set "part-of-speech" tags. As a result, words like "loving" which could be either a noun and a verb will be seen as a noun only and will remain unchanged after lemmatization. But if we assign "V" which is short for the verb, the word "loving" will be transformed to "love".
(2) Next, we define a function to clean the text data. The cleaning steps include convert the text to lowercase, remove non-alphanumeric characters and lastly lemmatize or stem the word depending on your preferences.
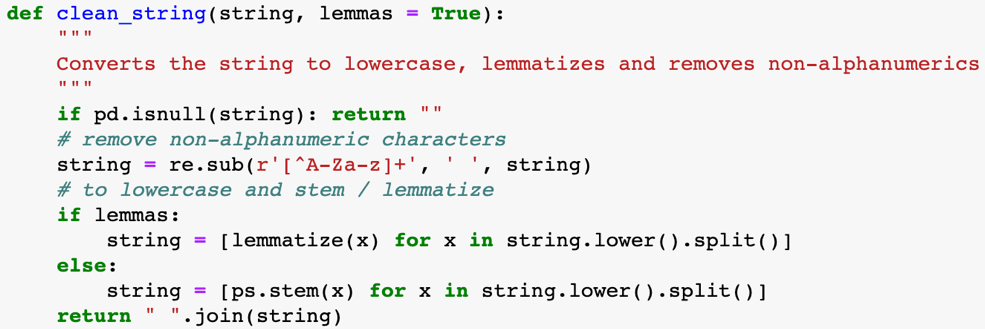
Note: this data cleaning function has the previous "lemmatize" function embedded, thus by calling this function with "lemma = True", we are also calling the lemmatize function.
Machine Learning:
About the algorithm:
What is it?
The algorithm I decided to use is called "Latent Dirichlet Allocation", and it is "a topic model that generates topics based on word frequency from a set of documents."
LDA is particularly useful for finding reasonably accurate mixtures of topics within a given document.
One simple way to understand this algorithm is to disassemble this name into individual word. "Latent" means hidden, as we are interested in finding hidden topics from a corpus. "Dirichlet" is a type of probability distribution, which means to find the hidden topics, we are using a probabilistic approach in comparison with other topic modelling algorithms such as "Non-negative matrix factorization" which relies on linear algebra.
An easier way to understand the underlying approach adopted by the LDA algorithm is: "every document is the probability distribution of topics and every topic is the probability distribution of words".
How does the algorithm work under the hood?
Assume there are two hidden topics in our corpus. First, the model will randomly assign each word in each document to one of the two topics.
Afterwards, the model will go through every word and its topic assignment in each document and check for two things: (1) how often the topic occurs in the document; (2) and how often the word occurs in the topic overall.
Based on the results, reassign the word a new topic when necessary. The model will go through multiple iterations of this. Eventually, the topics will start making sense, we can interpret them.
Implementation Requirement:
Before I cover the steps to build an LDA topic model, let us first take a look at what parameters are required for the algorithm to work.
Based on the official documentation of LDA implementation from Gensim, the following parameters need to be set to build a topic model successfully in our case:
"Corpus": Stream of document vectors or sparse matrix of shape (num_terms, num_documents).
"id2word": Mapping from word IDs to words. It is used to determine the vocabulary size, as well as for debugging and topic printing.
"num_topics: The number of requested latent topics to be extracted from the training corpus.
Above terms' definitions are direct copies from the official documentation, and I will talk about how we plan to prepare them in the next section.
In conclusion, your expectation for the model is to learn the topic mix in every document and word mix in each topic.
Implementation Steps and Details:
Now we know, we need "Corpus", "id2word" and "num_topic" to make it work for the algorithm.
Here is our plan: we will first focus on a specific year's review data and build different LDA topic models with the various value of "Corpus", "id2word" and "num_topic" until we are getting interpretable results.
Create different "corpus" objects to test which one is more meaningful;
Update "id2word" accordingly with changes in "corpus";
Start with "num_topic" equals to 2 and gradually increase the number of the topic until it starts making senses.
In order to decide the optimum number of topics to be extracted by our model, we will measure the model's "coherence value" at a range of possible numbers. Coherence measures the relative distance between words within a topic. I will talk more about this performance measure when we get to this part.
Until now, we are getting a sense of feeling that to build an LDA model is somewhat similar to build a K-Means clustering model. Topic modelling is also an unsupervised learning task, and there is no benchmark result and it all comes down to human intelligence and interpretation to decide if the output make any senses.
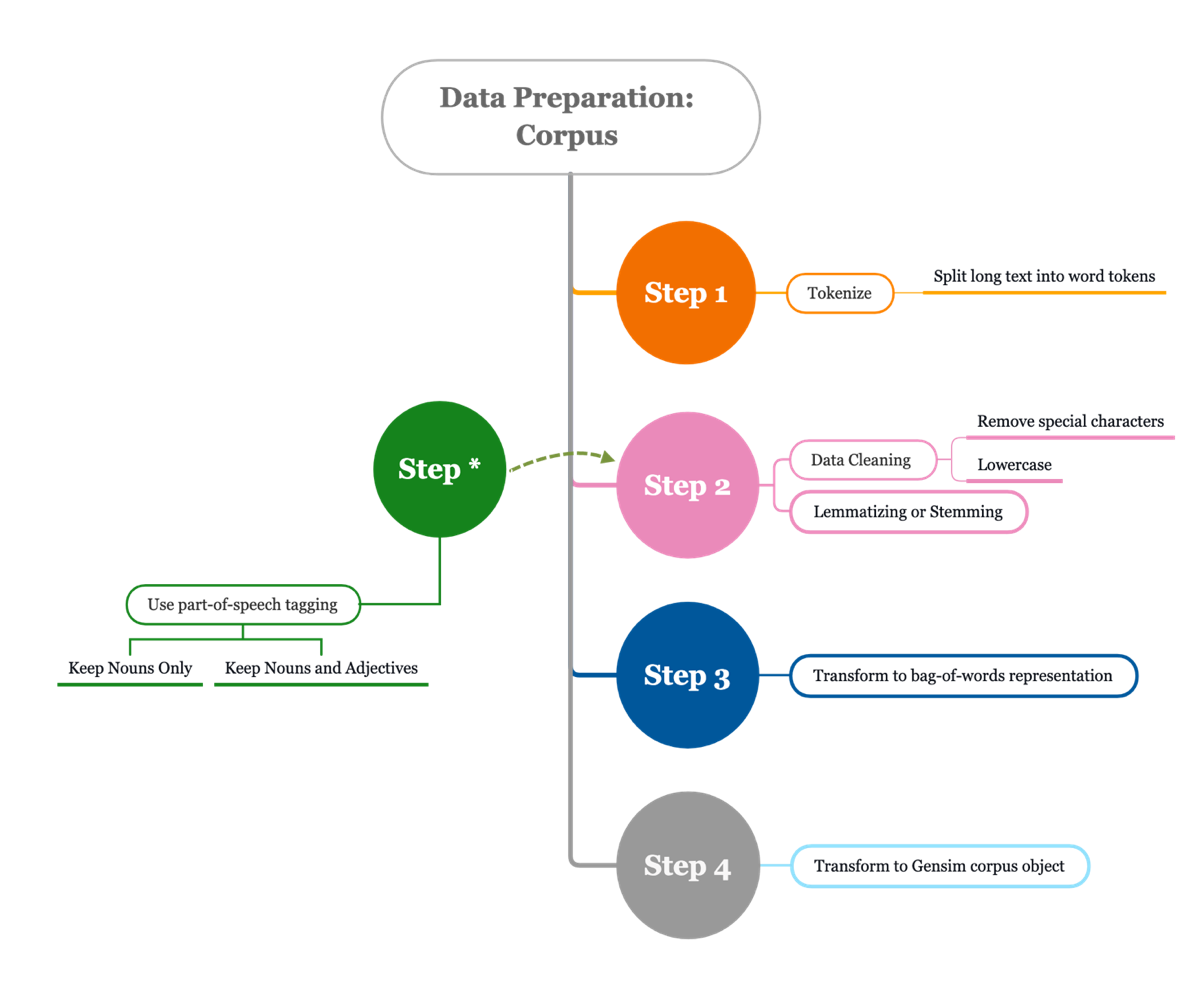
The process of building a corpus object can be found from the process map below.
The hands-on part begins:
I mentioned in the previous sections that we will focus on only one year's data first and transform reviews to different corpus objects and compare the results.
Attempt 1: keep all words
Isolate reviews from 2019

Use the functions defined above to process reviews (Step 1 and 2)

To create a bag-of-words representation, we use "CountVectorizer" class from Scikit-Learn. (Step 3)
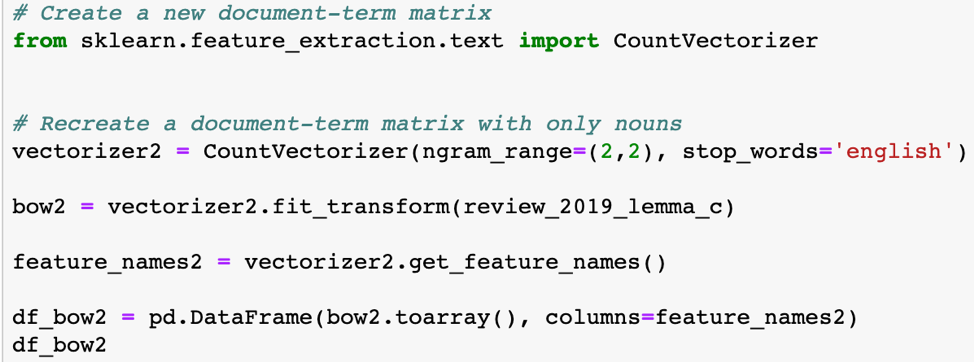
Note: above we converted all reviews to a matrix of token counts and built a Pandas data frame with it. The reason why we use Scikit-Learn to get "BoW" representation of data instead of calling Gensim built-in class like "dictionary.doc2bow" is because it would be easier for me to recycle the data and apply other downstream modelling and analysis to the data.
Moreover, I chose bigrams as the opposite of one gram since the latter does not provide meaningful value in our case (the implementation of one gram can be located in the notebook).
This is what our data looks like:
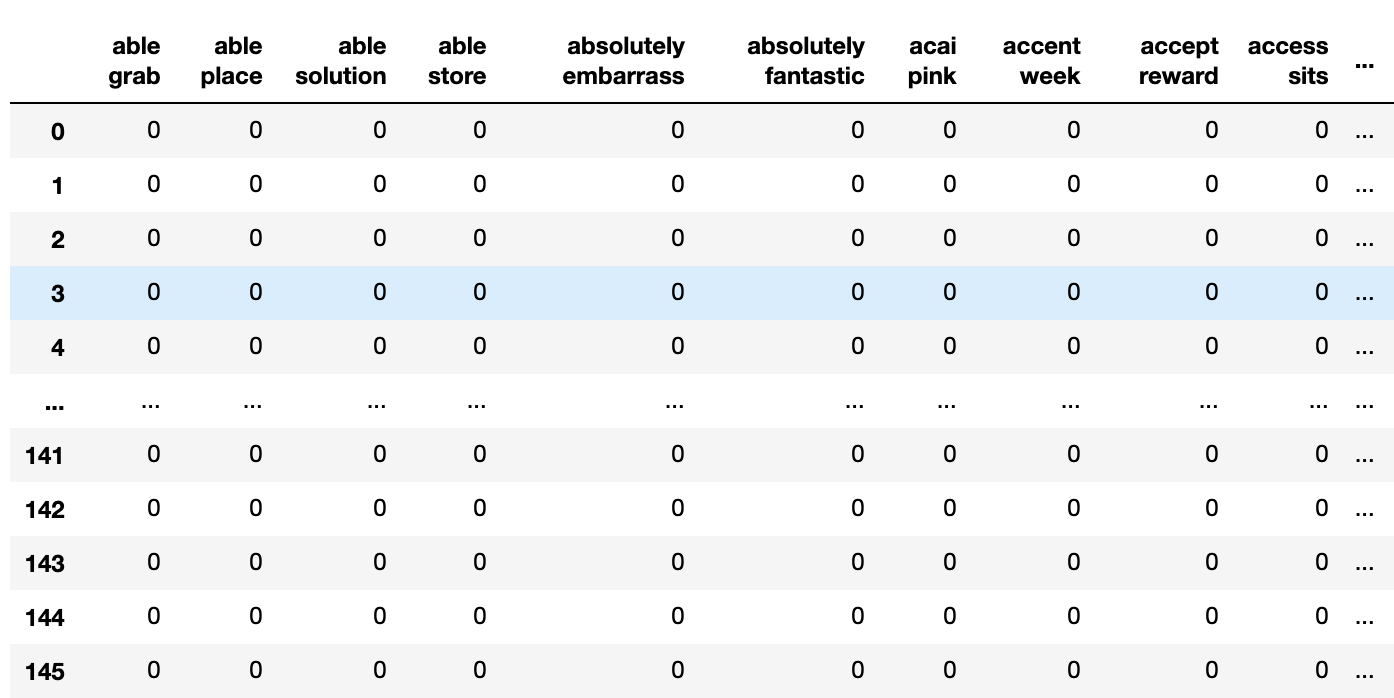
What we get is a document-term matrix/data frame with each row represents a review, and each column is a count of token across all reviews.
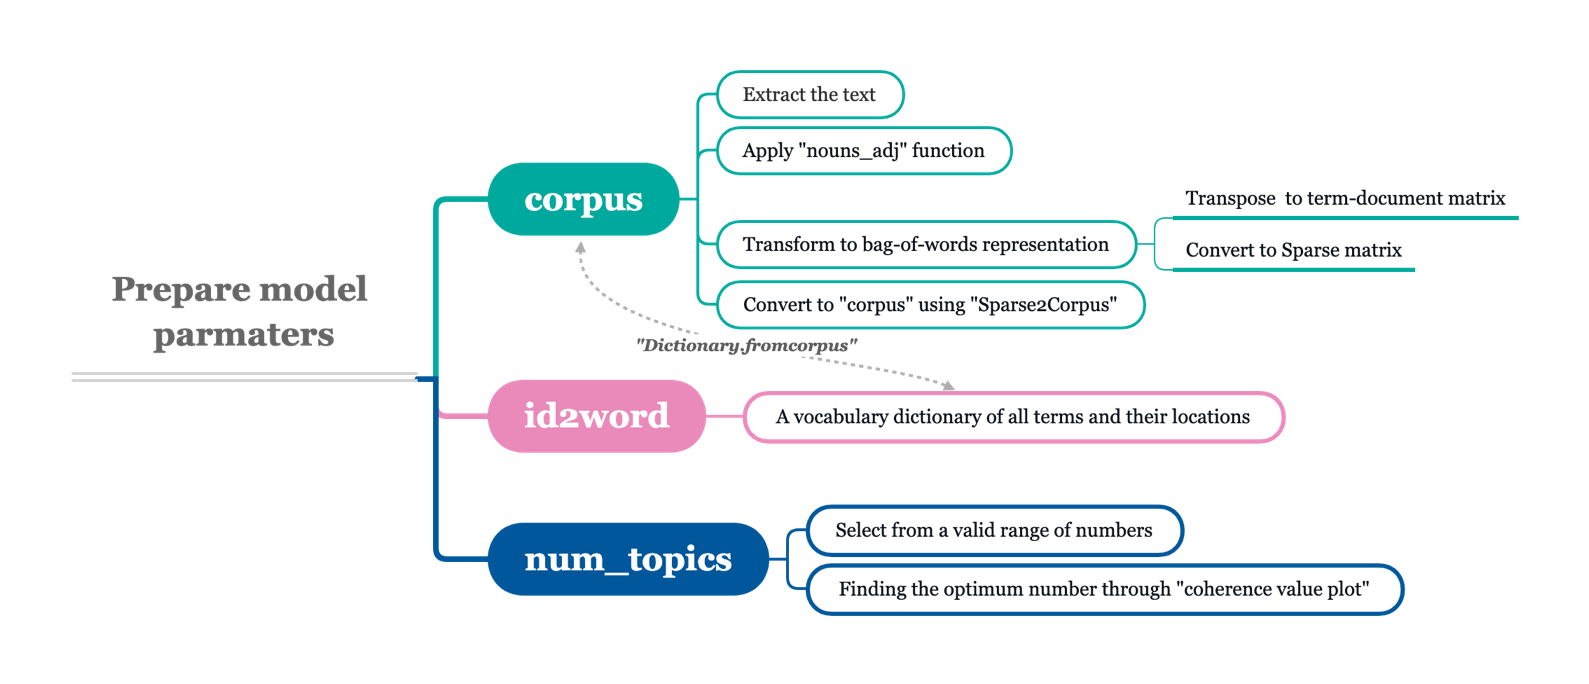
To finalize our preparation prior model building, we transpose our document-term matrix to a term-document matrix then transform to a Scipy sparse matrix. Lastly, we use "Sparse2Corpus" class from "math utils" class to convert it to Gensim recognizable corpus object.
Moreover, we prepared the last required parameter "id2word" by creating a vocabulary dictionary of all terms and their respective locations in the term-document matrix

Building the first topic model with "num_topics =2"

Print out 2 topics extracted by the topic model.
(0, '0.002*"butter cup" + 0.002*"peanut butter" + 0.001*"make sure" + 0.001*"chocolate peanut" + 0.001*"tea latte" + 0.001*"friendly staff" + 0.001*"dark chocolate" + 0.001*"cup coffee" + 0.001*"staff member" + 0.001*"starbucks location"'),
(1,
'0.002*"staff friendly" + 0.001*"customer service" + 0.001*"make drink" + 0.001*"starbucks location" + 0.001*"drink make" + 0.001*"service great" + 0.001*"green tea" + 0.001*"mobile order" + 0.001*"taste like" + 0.001*"wait long"')
Findings from the result:
Above topic model produces 2 topics: "0" and "1" where each topic is a combination of keywords and each keyword's relative importance/contribution to its assigned topic.
Topic 0 seems to be about the product and especially the product which contains "butter" or "peanut butter"
Topic 1 seems to cover more about customer service
What will happen if we ask the model to extract 3 topics? Or 4 topics?
"num_topics" =3

Print our 3 topics extracted by the topic model:
(0, '0.002*"starbucks location" + 0.002*"make drink" + 0.001*"tea latte" + 0.001*"drink make" + 0.001*"green tea" + 0.001*"dairy free" + 0.001*"place order" + 0.001*"order wrong" + 0.001*"work starbucks" + 0.001*"coconut milk"'),
(1,
'0.003*"peanut butter" + 0.003*"butter cup" + 0.002*"staff friendly" + 0.002*"chocolate peanut" + 0.001*"super friendly" + 0.001*"cup coffee" + 0.001*"dark chocolate" + 0.001*"mobile order" + 0.001*"make sure" + 0.001*"staff super"'),
(2,
'0.001*"customer service" + 0.001*"staff friendly" + 0.001*"taste like" + 0.001*"wait long" + 0.001*"long drink" + 0.001*"friendly staff" + 0.001*"like starbucks" + 0.001*"coffee taste" + 0.001*"ask iced" + 0.001*"great starbucks"')
Findings from the result:
We are certainly getting more information from the topic model. However, noticed that there are many terms which do not make too much sense but are appearing across three topics such as "make drink" from topic 0, "make sure" from topic 1, and "taste like" from topic 2. These are the noises to our topic model, and it is time to consider use part-of-speech tagging to include only nouns or a combination of nouns and adjectives in our analysis.
Attempt 2: keep nouns and adjectives
To isolate nouns and adjectives for each review, we defined a new function to do these:

What above function does is to first tokenize each review and for each token, use part-of-speech tagging to figure out whether it is a noun or an adjective or neither. Lastly, the function keeps only nouns and adjectives from each review which then are processed and cleaned like what we did before.
Processing and Preparations:
We use identical data process and preparation steps throughout the model building phase, therefore the work itself is not shown here which can be found in the actual notebook. Kindly refer to below visualization for a clearer understanding of steps we take to prepare model's parameters.
Building an LDA topic model with initial "num_topics" set to "2".

Note: Here we are using "LdaMulticore" class instead of "LdaModel" class. The difference is the former one utilizes all CPU cores to parallelize and speed up model training. This is especially useful when you encounter large data size. "passes=10" meaning we want the model to go through 10 iterations to produce more stabilized results and "min_probability=0" helps us later on when we evaluate 'topic distribution among each review.
Result:
(0,
'0.003*"staff friendly" + 0.002*"peanut butter" + 0.002*"butter cup" + 0.002*"customer service" + 0.002*"starbucks location" + 0.002*"chocolate peanut" + 0.001*"staff member" + 0.001*"mobile order" + 0.001*"dark chocolate" + 0.001*"dairy free"'),
(1,
'0.002*"tea latte" + 0.002*"friendly staff" + 0.002*"green tea" + 0.002*"starbucks location" + 0.001*"service great" + 0.001*"time drink" + 0.001*"location busy" + 0.001*"service good" + 0.001*"first time" + 0.001*"favourite starbucks"')
Findings from the result:
We are getting two topics from the model, and each one is a mix of product reviews and service reviews. Again, we have mentioned in the previous "Methodologies & Challenges" section that the biggest challenge for our LDA model is to produce well-separated topics as most reviews will contain a mix of messages. But the outputs are still meaningful in a sense that we know what draws our customers' attentions.
Later on, we will use a visualization package called "pyLDAvis" which is designed to help users for a better understanding of the individual topic and to discover relationships between topics produced by our topic model.
Model performance evaluation:
In general, there are two widely accepted evaluation measures for LDA topic models, and one is called "Perplexity" and another is called "Topic Coherence". Again, topic modelling is an unsupervised learning task and it is highly dependent on your usage to evaluate a topic model. Both perplexity and topic coherence are part of intrinsic evaluation metrics.
An example of measuring perplexity using our model.

In short, perplexity measures how well a probability model (LDA in our case) predicts on unseen data, and its value is calculated as the inverse probability of test set, normalized by the number of words. I won't go in-depth about the mathematical details here and what we need to know in our case is that we want this value to be lower.
In comparison, we have another important model performance evaluation technique called "Topic Coherence", which measures the relative distance between words within a topic. There are several different methods to calculate coherence and the one I used in this project is called "C_v" which is based on normalized pointwise mutual information (NPMI) and cosine similarities. We won't go into the mathematical details here as it is not our focus for the summary. We just need to know the value of "C_v" is between 0 and 1 and we prefer to have the coherence close to 1.
Finding the ideal number of topics by coherence plot:
First, I used a function found from "Stack Overflow", and revised to make it works to our data.
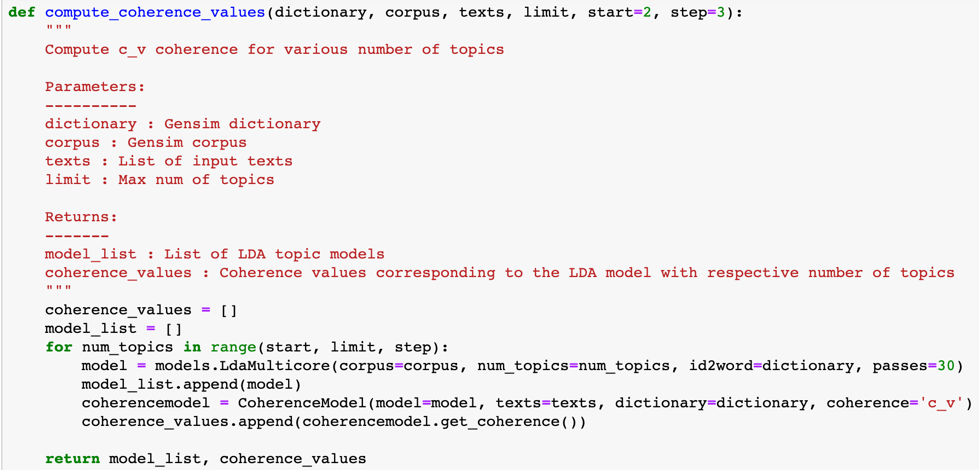
This function takes the same inputs from our previous LDA model with the addition of "texts" which is a list of all terms in our vocabulary dictionary and "limit" which sets the maximum number of topics we want our LDA model to extract.
Next, by calling this function with desired inputs, we will get two things in return. A list of models we built using various values of "num_topics" bounded by the limit and a list of correspondent coherence value for each of the model.

Let's plot it to see at which value of "num_topics", our coherence score is at the highest.
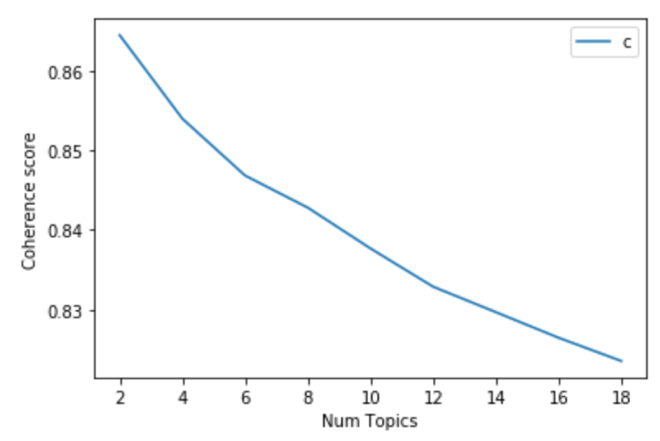
We can tell from the above plot that starting from 2 topics, as the number of topics going up, the coherence score is going down.
Let's check out the coherence score when "num_topics" equal to 2:

Usually, a topic model with coherence score above 0.7 is considered good, and above 0.9 is very unlikely unless the words being measured are either identical words or bigrams. In our case, customers are likely talking about similar things and we use bigrams thus the result is understandable.
Finally, we can use "pyLDAvis" to visualize our topic model:
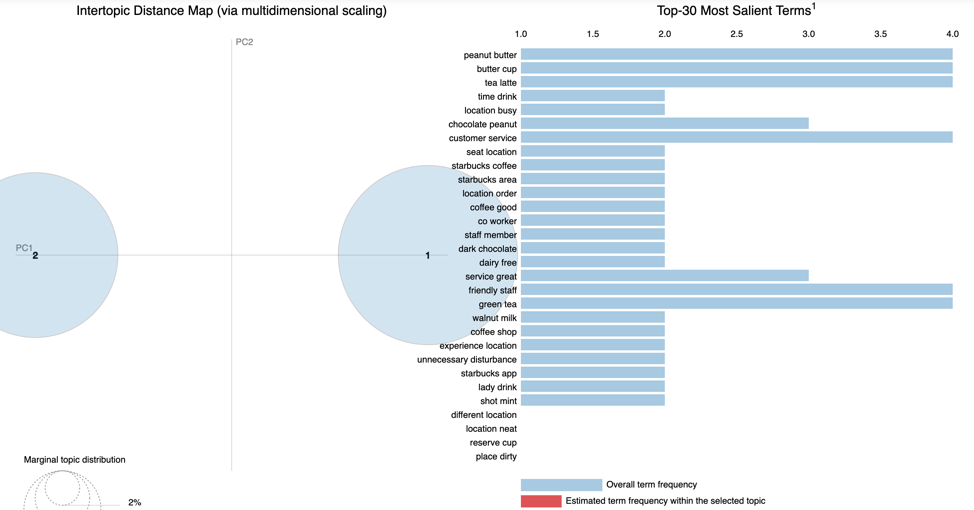
Each bubble on the left-hand side plot represents a topic. The larger the bubble, the more prevalent is that topic. A good topic model will have fairly big, non-overlapping bubbles scattered throughout the chart instead of being clustered in one quadrant.
On the right-hand side, the horizontal bar chart represents the most salient terms or words which formed these topics. In the notebook setting, if we hover our mouse to place it on either one of the two bubbles from the left, the bars will update accordingly to reflect the corresponding relevant terms for the individual topic.
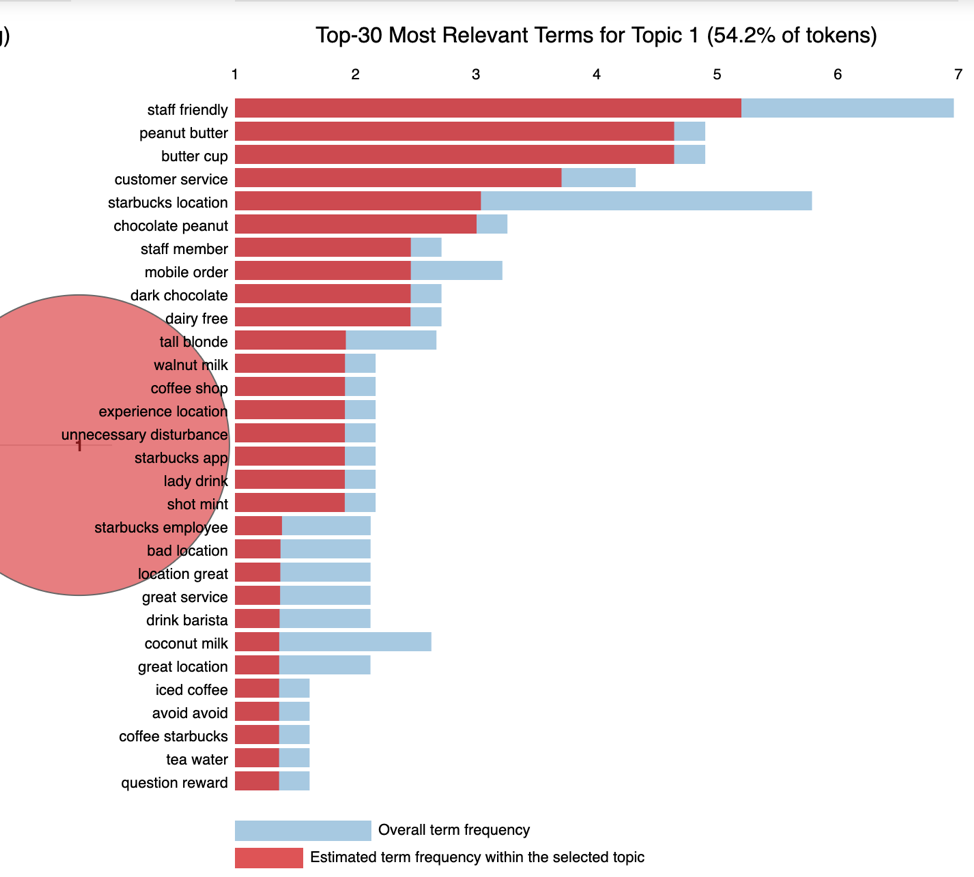
For example, below is what we get when we hover over "topic 1":
Recall the main goals for using pyLDAvis package is to:
1: help users better understand the individual topic;
2: find relationships between topics.
For example, above plot helps us determine the most useful terms to interpret topic 1, and it should be about customer service received by customers and also the drink which he or she ordered which possibly is "Peanut Butter Cup Frappuccino".
Post-LDA model analysis and visualizations:
(1) Topic distribution across documents (across reviews in our case)
If we are interested in knowing the probability of each review belongs to each topic, we can do the following things:
Step 1: get the probability distribution of all reviews

Step 2: Put it into a data frame and in this case, and we use the "business_id" as the row index. Therefore, in some cases, there will be duplicate business ids when each receives more than one review.

(2) Dominant topic counts
After we created a data frame that shows the probability of each review falls into each topic, we can insert another column with the value being the name of the topic that each review is most likely belong to and we call this the "dominant topic".
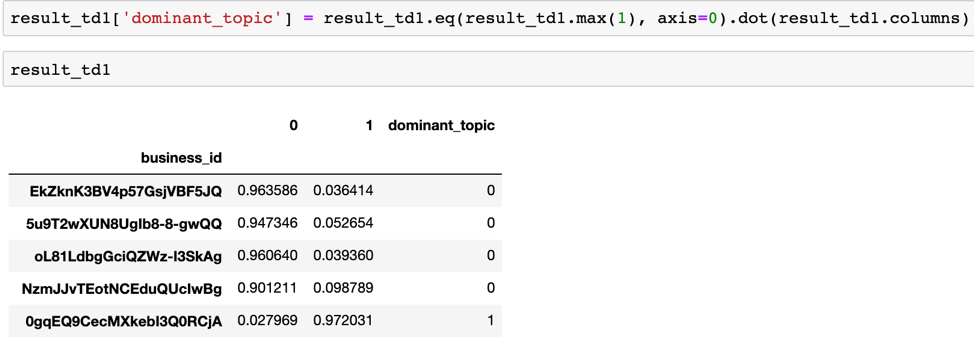
We can copy this new column to a new dataframe and prepare for aggregation.
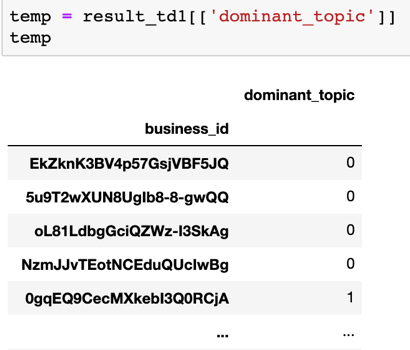
Now, we just need to aggregate to get the total number of reviews that belong to each topic.

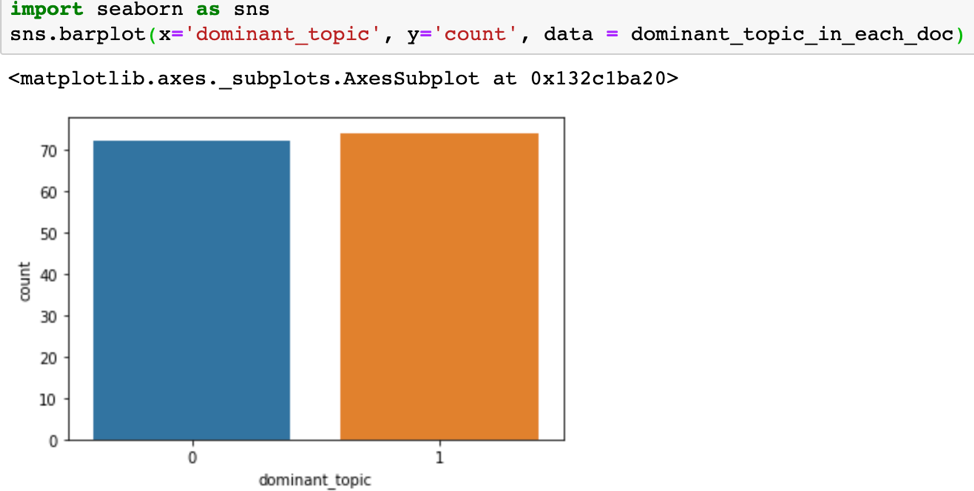
There are 72 reviews from Starbucks reviews in 2019 belong to "topic 0" and 74 are from "topic 1". We can use a bar plot to make it look a little nicer.
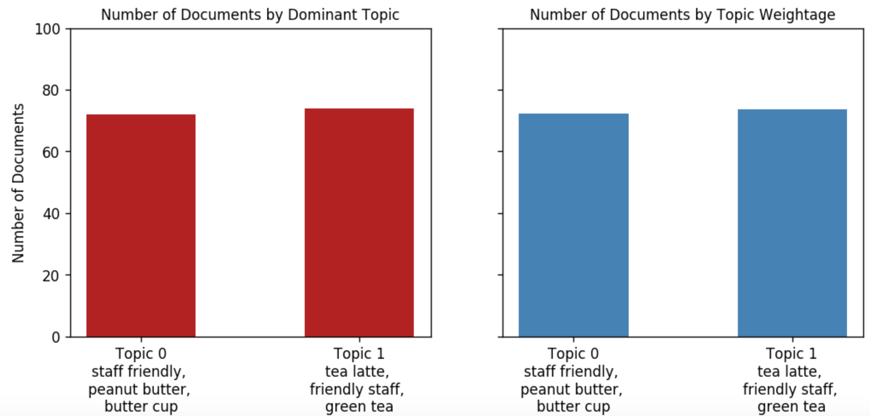
(3)Sometimes we want to know which topic is more important in the context of comparing the actual weightage that each topic is accounted for.
First, we create a new data frame from copies of selected columns from (1). Next, we compute the sum of the probabilities for each topic among all reviews to get the weightage of topics.

Here we make a bar plot similar to what we did above but this time we include the top 3 keywords in the x-axis labels for better presentation. The one on the left is a rework of the previous bar plot from (2), the one on the right is what we just computed.
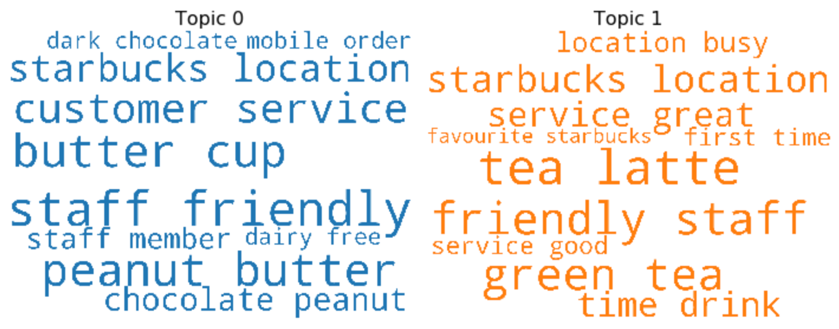
(4) Just like what is shown in pyLDAvis, we can also use word clouds to show keywords from each topic
There are many more things you could do with results from LDA topic models depending on your demand and use-cases. A nice tutorial shows how to present results from the LDA model with various manipulations and visualizations can be found in this link: "https://www.machinelearningplus.com/nlp/topic-modeling-visualization-how-to-present-results-lda-models/#12.-What-are-the-most-discussed-topics-in-the-documents?"
Current Issue:
Until now, we have only focused on reviews from 2019 and one major issue we found from produced topics is that some keywords such as "friendly staff", and "customer service" which contribute greatly to form these topics are non-product related and repeated in both topics. Therefore, it impairs the model's ability to give us the information we want (i.e. products that customers talk about).
The intuition behind our topic models is to help us understand what customers care about at different points in time thus we can capture shifts in demand changes.
Proposed Solution:
What we can do now is to add those words that we don't want our model to pick up into the "stop_words". Recall we remove stop words such as "the", "is", "at" when calling "CountVectorizer" class to create a bag-of-words representation of the data. We just need to include those new terms in our stop words list.
Attempt 3: Nouns and Adjectives with updated stop words (we expand to cover reviews in 2018 and 2017)
Update Stop Words list:

Rebuild the parameters and run different models:
The implementation steps are not shown here as they are similar to what we did in the previous attempt 2. Eventually, we applied the same data processing, data cleaning, parameter building, model building for reviews in 2018 and 2017 as well.
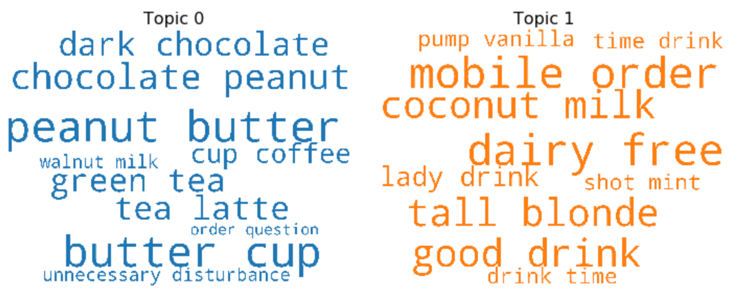
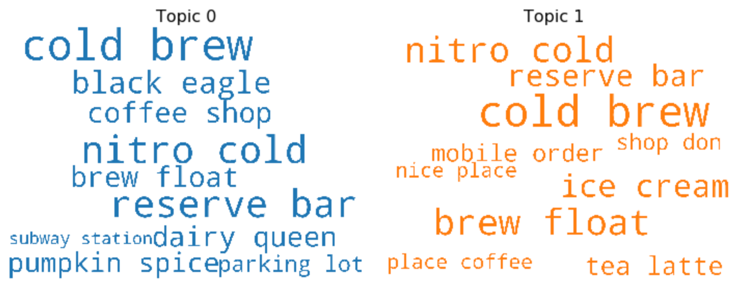
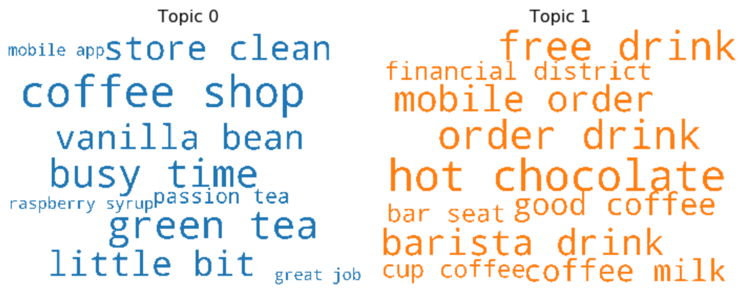
Each year's topic presented in word clouds:
2019:
2018:
2017:
Takeaways:
After getting those keywords which form each topic every year, I did some research with those words to find out what the product it relates to. This step is very important as the interpretation of topic models often required domain knowledge and human intelligence. Below is what I conclude:
2019:
Topic 0: It is mostly about a product called "Peanut Butter Cup Frappuccino" and it is not a regular item from the menu but rather belongs to the secret menu which customers need to specifically ask to get it.
Another popular item customer like to talk about is "green tea" and this expands further to hot teas and tea latte. Both of which remind Starbucks that there are good portions of its customers are tea drinkers, and its diversified product line makes it easier to please customers with different taste and demand.
Topic 1: Customers concentrate on the non-dairy milk substitutions such as "coconut milk", and there are also talks about the mobile order system.
2018:
Topic 0: 2018 marks the year when "Starbucks Reserve" store first opened in Toronto based on my researches online and from the part I exploratory data analysis. There are lots of talk around the store itself and the unique items it carries. For example, "black eagle" represents the black eagle espresso machine used at the reserve bar which allows baristas to make latte art and this express a completely different brand image to the customers. This further proves that Starbucks uses different market positioning strategies for its regular stores and reserve stores. Another interesting keyword is "nitro cold" which represents "Nitro Cold Brew", a cold brew coffee infused with nitrogen for hint sweetness without using sugar. One last thing we want to focus on is, we have been compared with "Dairy Queen" for some unknown reasons.
Topic 1: Again, lots of mentions are about cold brews, and surprisingly "ice cream" appears in the topic, and this is probably why customers are comparing Starbucks with Dairy Queen. After some researches, I found out in some select reserve stores, Starbucks offers its customers a new experience by adding a scoop of ice cream insides a cold brew float.
2017:
Topic 0: Although we removed many keywords to keep the new topics more product-centric, we still saw terms like "coffee shop", "busy time" which emphasize on customers experience with their visits. Product-wise, "vanilla bean" is heavily mentioned and it should represent "Vanilla Bean Frappuccino". In addition, "green tea" appears again in our topic like in 2019.
Topic 1: The main product of interest is 'hot chocolate" and customers also mentioned "free drink" which is part of Starbucks reward program. Again, there are some reviews regarding "mobile order". The remaining part is mostly about store experiences.
Conclusion:
Based on the results from topic modelling on each year's review for Starbucks, we have gained a clearer understanding of where its customer interests lie.
How we can make the best use of these results is another important thing to think about. An example could be, if we found certain items are heavily discussed, maybe we should perform some analyses around those items such as figure out the total sell-out quantities which help the company understand the popularities among those items in our customer base. Therefore, the company can include them in the next marketing campaigns.
We need to keep in mind, these topics extracted from our topic models only give us an idea of what reviews are about at different points in time. It is our job as a human to interpret them, and a valid interpretation much consists of scientific researches and experts' knowledge. We can make any bold assumption base on those topics, but we must conduct additional analyses and research to give proper recommendations to the business.
Attempt 4: Use negative reviews only to find out what customers complain about.
Extract negative reviews only for each year:
Example:

Process, clean, build parameters and build various LDA models:
The implementation steps are not shown here and we follow the same steps to build these models.
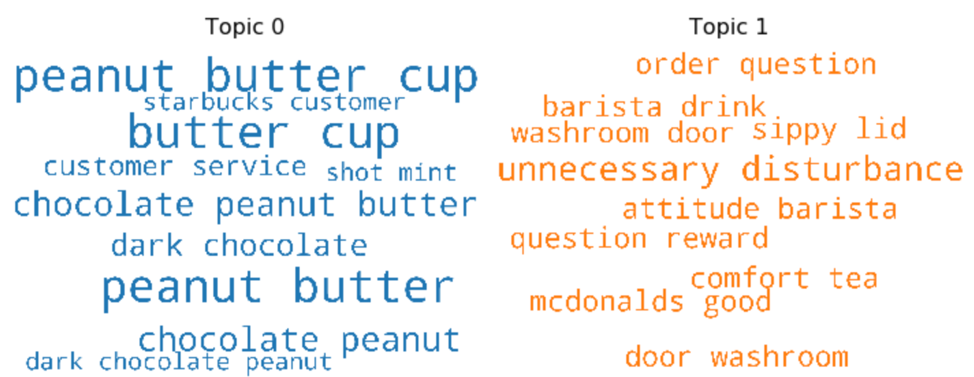
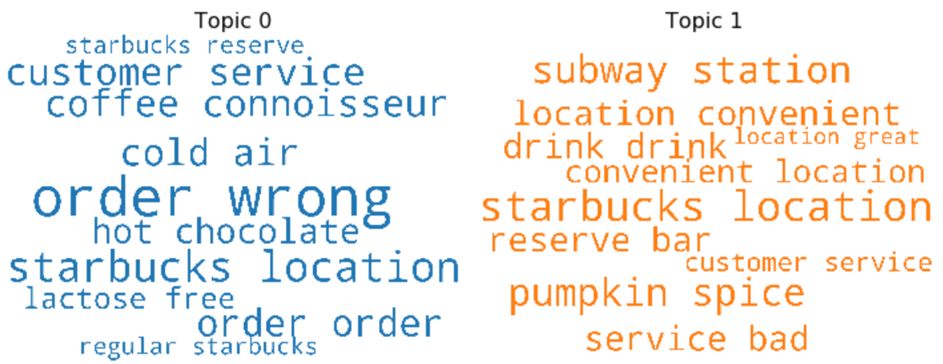
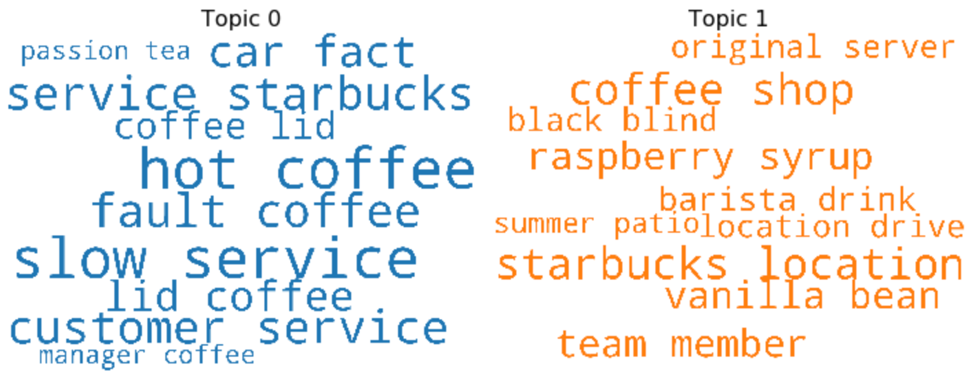
Topic Model Results in Word Clouds
2019:
2018:
2017:
Takeaways:
2019:
Surprisingly we found "peanut cup", "peanut butter", "chocolate peanut" in the word cloud, and these terms contribute greatly to topic 0. Recall this time we have negative reviews only, and this is a good signal that we should dig deeper and possibly trace back to the reviews that mentioned those terms. It is either dissatisfaction directly against the product itself or related to the experiences of getting the product.
From topic 1: the complaints are more obvious and direct. In general, we can divide the complaints into two different groups: having issues with specific stores or having issues with products in general. For example: "washroom door", "attitude barista" and "unnecessary disturbance" are customer complains made directly to the store they visit. In comparison, "slippery lid", "question reward", and even "mcdonalds good" are customers having issues with our products.
2018:
Let's do the same thing by dividing complaints into above proposed two groups and we name them: "Store complaints" and "Product complaints".
Store complaints are spread around the following issues: customer service such as "service bad", store location such as "subway station" and in-store experience such as "cold air" and "black blind". Product complaints are mainly focused on the following items: hot chocolate, lactose-free milk, pumpkin spice latte and raspberry syrup.
2017:
Most store complaints are made against customer service, location convenience and wrong orders. This time, the product complaints are mostly about coffee lids, "Vanilla Bean Frappuccino".
Conclusions:
We divided the results from our negative-review-only topic models to two meaningful groups: "store complaints" and "product complaints". Although these results are not being validated yet as in we know those keywords bring in great contributions to form those topics but we don't know whether the complaints are in direct relationship with the keywords. Another way to put this is we don't know if the complaints are caused by the keyword. However, the model still gives us an overview of the issues customers had with Starbucks. There are many different ways for us to utilize these results depending on the use-cases. For example, if we can find reviews that best contribute to the store complaints and then we pass on to the district manager and individual store managers. They can resolve the complaints and turn them into valuable lessons for future reference. The different product teams at Starbucks can leverage product complaints to build better product upgrading and updating strategies.
Finding the most representative review for each extracted topic:
The last thing I want to demonstrate is to find the most representative document or review in our case for each new topic extracted by our topic model. This helps us to validate the results from topic models using an extrinsic way.
We use reviews from 2019 as an example. First, let's compute topic distribution across all reviews.
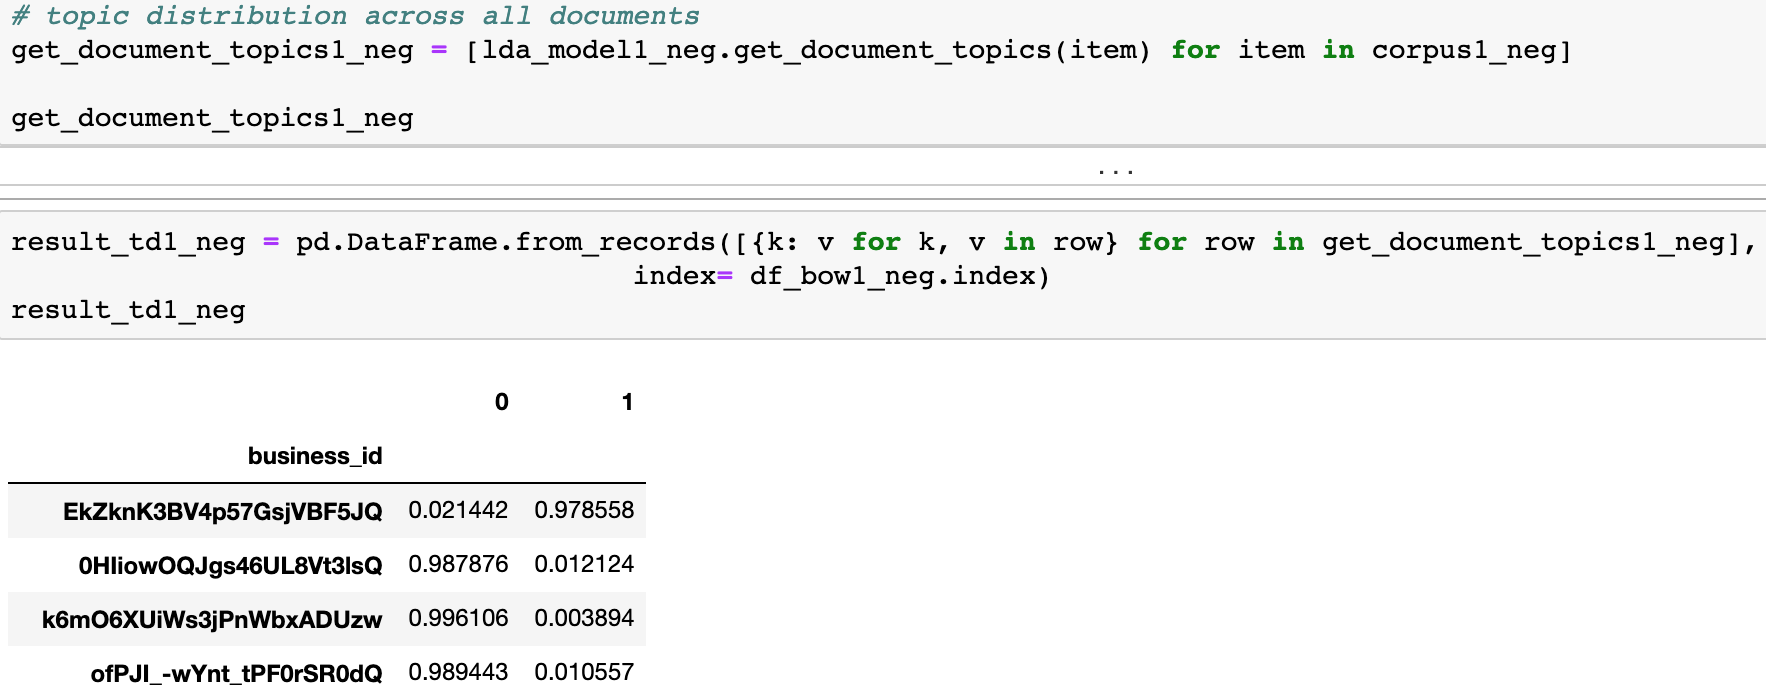
We have duplicated "business_id" since it is possible to have multiple reviews for one store. Hence, later on, we need to reset the index.

Next, we concatenate the original reviews to our topic distribution data frame, and below is what we get. (index has been reset, 14 rows shown and 43 in total)
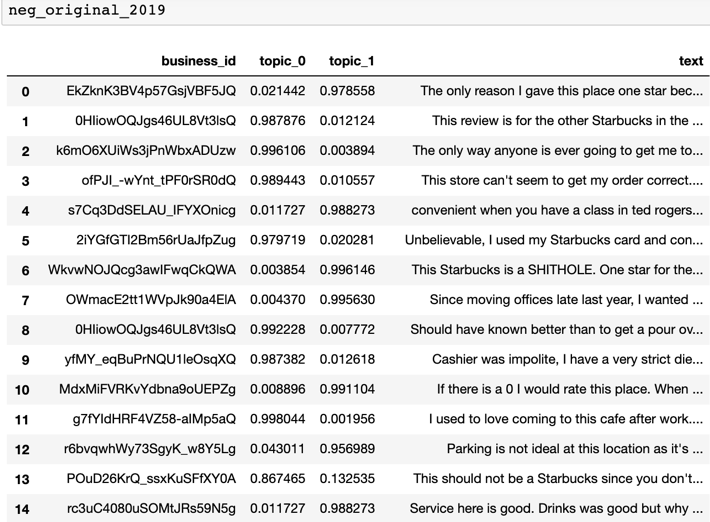
Now, we use "idxmax" function to return us the index of maximum topic distribution in topic 0 and topic 1.
The most representative review for "topic_0" is at index equals to 11.

The most representative review for "topic_1" is at index equals to 6.

Finally, let us print out these two reviews:
The first one that best represents topic 0. It is a lengthy review and it is close to 400 words. The topic distribution for this one is:


The second review which best represents topic 1. The topic distribution for this one is:


What we can conclude after reading these two reviews:
(1) Based on the actual contents of these reviews, our topic models did a fine job of capturing the main topics.
(2) It proves that the keywords that choose to form the topics extracted by topic models are only able to tell you what the topics are related to, in another word, those keywords are only a measure of relevancy.
Let's use a more concrete example to explain this. When we build topic models on negative reviews in 2019. Topic 0 is made up of keywords such as "peanut butter", "butter cup", "chocolate peanut". We thought something is wrong about this "peanut butter" related products, maybe they did not taste good. After reading the most representative review for this topic shown above, we understand this particular complaint is about a customer not able to get the product he wanted which is "Reese Peanut Butter Cup Frappuccino", and he loves this product but was unsatisfied because the barista who served him did not know what it is.
Summary of this project:
This marks the end of our "Topic Modelling on Yelp reviews for a retail chain, the case of Starbucks". Throughout this paper, we covered how to build topic models using an algorithm called "Latent Dirichlet Allocation". Eventually, we built several topic models on different year's Yelp reviews for Starbucks to understand what customers care about at different points in time. We also concentrated on all negative reviews received from customers to figure out which parts did customers have issues with Starbucks. Therefore, we can come up with valid recommendations to help the business turn negative complaints to positive customer experience.
Future works:
(1) Try topic modelling with different algorithms (such as NMF, or LDA Mallet) on the same data and compare the results.
(2) Try topic modelling on different data sources using the same approach to gain a more unbiased understanding. For example, using tweets from twitter and reviews from Google.
