This post is the continuation of my previous blog "Customer Analytics in Retail Business".
General Process

Recap
In my previous blog, I demonstrated how to divide the customer into different meaningful subgroups. The features are built using a marketing technique called "RFM" which stands for "Recency", "Frequency" and "Monetary".
Moreover, I tried various clustering algorithms such as "K-Means", "DBSCAN", and "Hierarchical Clustering"...etc, to find the optimal solution to segment our customers.
What's next
The data we used is an example of transaction, account and user data from a financial institution. I did a few modifications to make it suitable for our case. Assume this institution wants to target customers for credit card offers, and it decides to create two test groups and one control group. The detailed set up is as follow (we choose the clustering result from K-Means) :
| Segments | Groups | Details |
|---|---|---|
| Cluster 0 | ControlGroup | No Offers |
| Cluster 1 | TestGroup1 | Pre-Approved Cards |
| Cluster 2 | TestGroup2 | Email Ads with First Year Service Fee Waived |
| Cluster 3 | TestGroup2 | Email Ads with First Year Service Fee Waived |
(The purpose of this blog is to demonstrate how to measure campaign effectiveness and the details about how to design an AB testing will be introduced in the follow-up post.)
Let's fast-forward, and we get campaign response data. Now what?
Experienced marketers often say no marketing stratgy guarantee to work. Even if there is one that seems to be effective and working well but as time and surrounding changes (market demand, competitions...etc.), the results will change too. You have to act quickly to the changes that just occurred and to achieve this, you are expected to keep coming up with new ideas, experimenting and learn from those experiments.
When we are talking about marketing, we are also talking about the cost. Measuring the effectiveness of different campaigns help us to maximize the profit gains.
Work Begins
Objective
Does giving an offer help with conversion? If so, we want to know which campaign is more effective and by how much?
Build a predictive model to calculate the probabiliy of a customer to take the campaign offer.
Data
Here is what our data looks like:
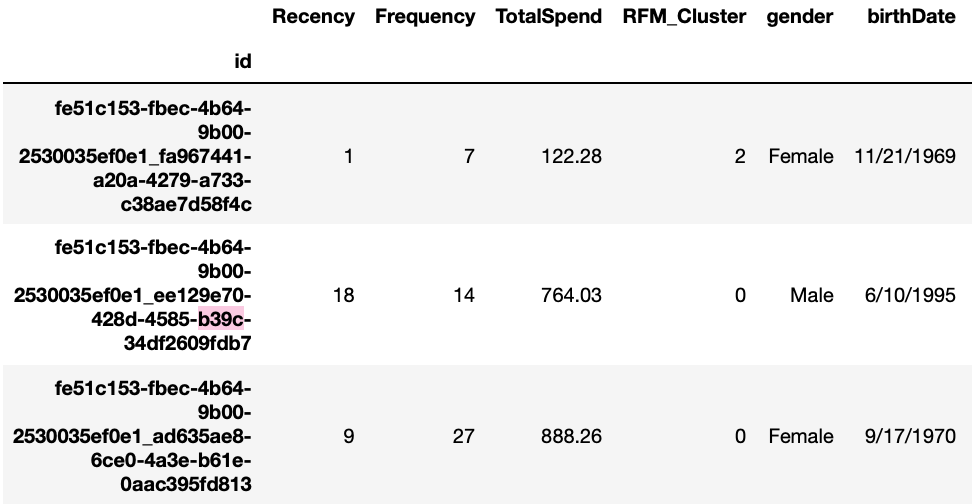
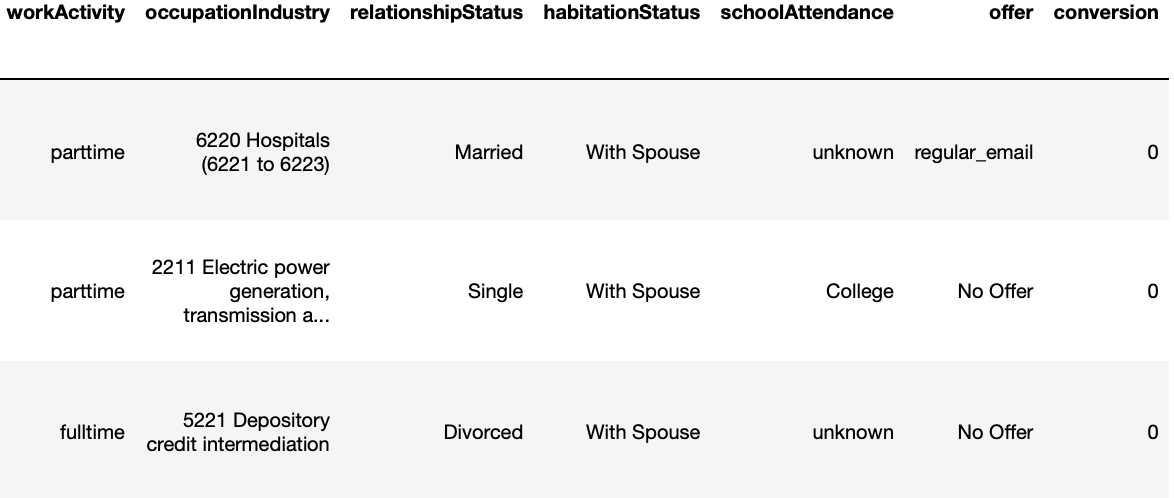
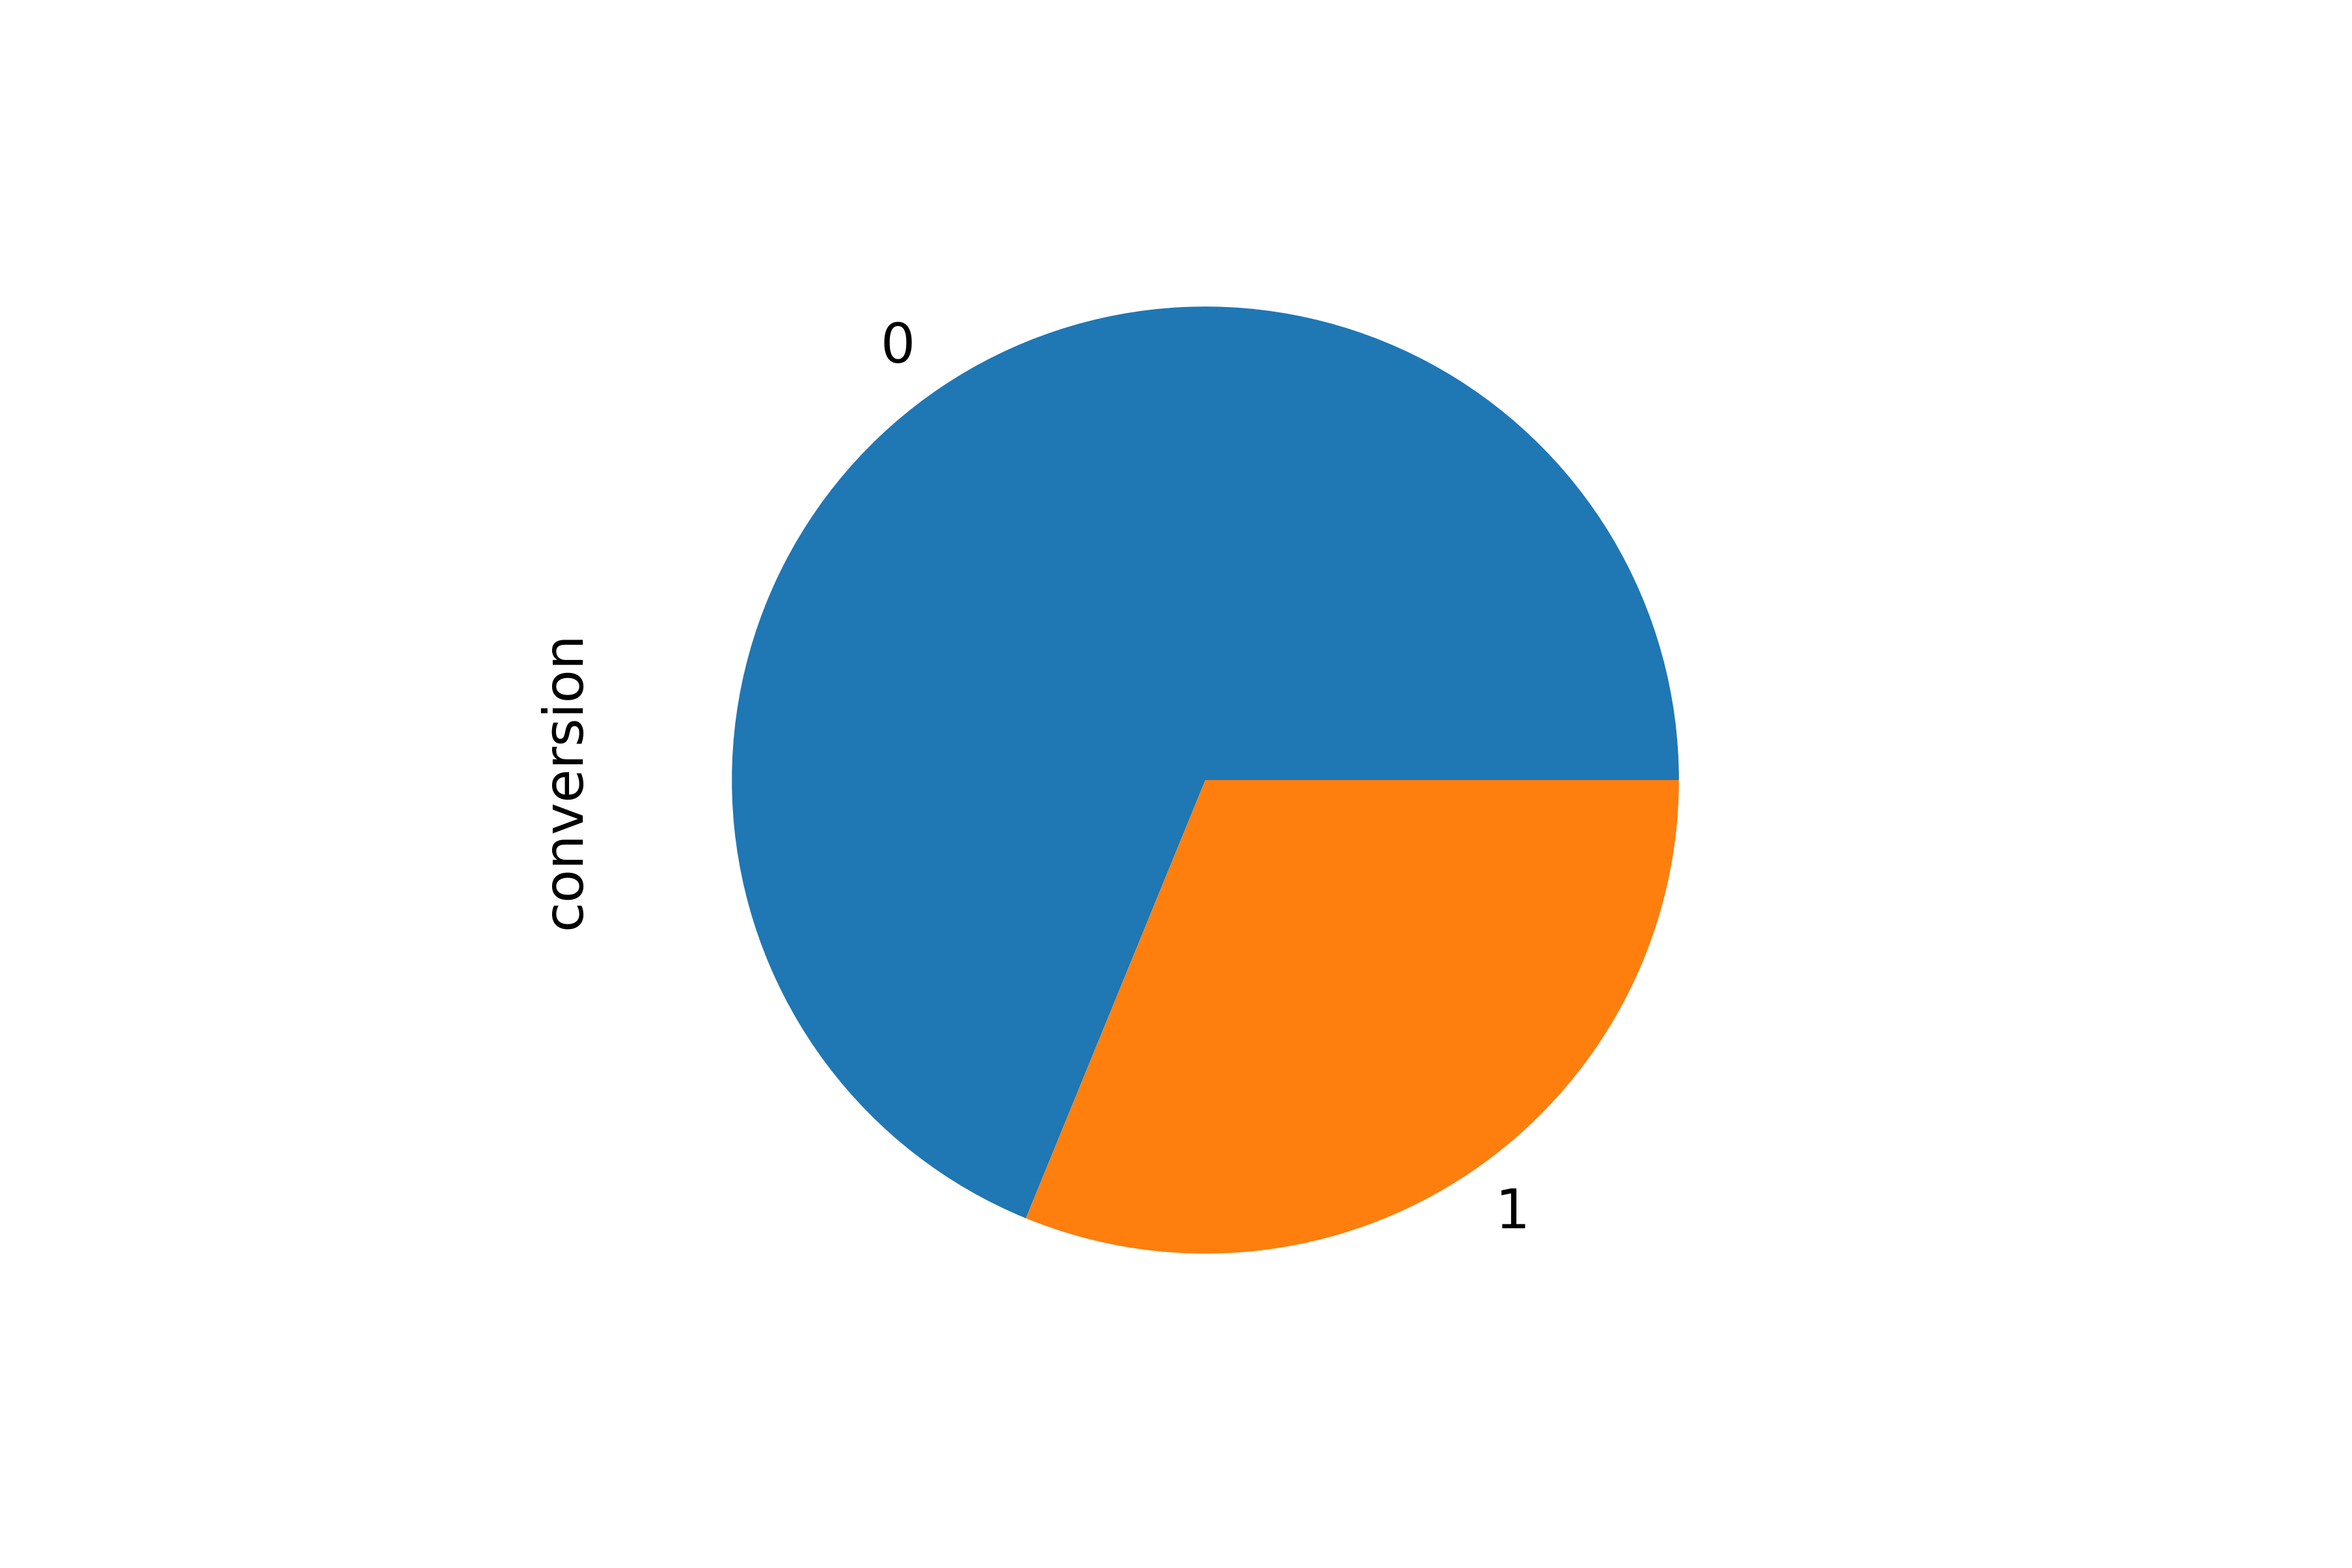
Notice that the "conversion" column is our response label which contains binary value 0s and 1s. 0s are customers who did not take the offer, and 1s are customer who accepted the offer(about 31% of 1s and 69% of 0s in total).

Column Descriptions:

Data Manipulation for Insights
We skipped a lot of initial data understanding and exploration steps here because we did it the precious customer analytics post. We jump right to the findings:
Findings 1:
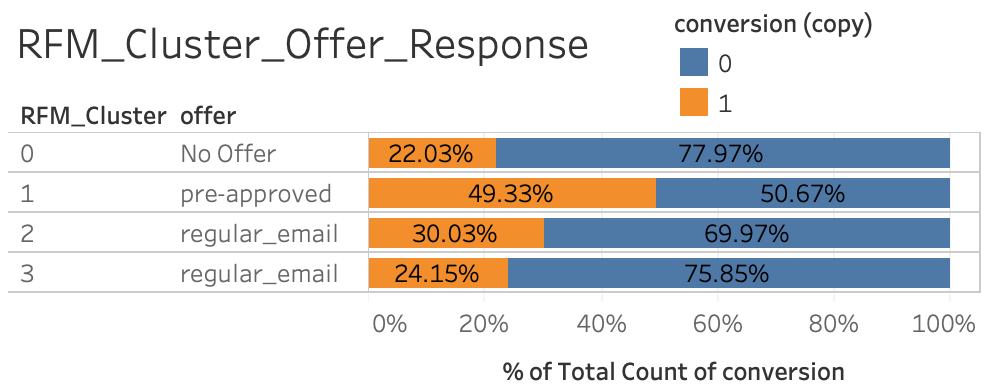
This tells us the percentage of conversion and non-conversion in each cluster group.
Findings 2 - Measure Campaign Effectiveness:
(1) Now, let's calculate the real offer conversion rate and compare the results to our base group ("No Offer").

This tells us the conversion rate for each offer type and we can conclude that giving an offer does help with conversions.
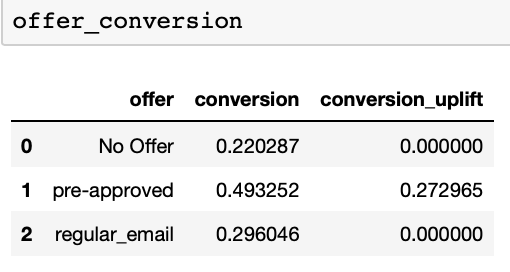
(2) Calculate conversion uplift:
Conversion Uplift = conversion rate of test group subtract conversion rate of the control group
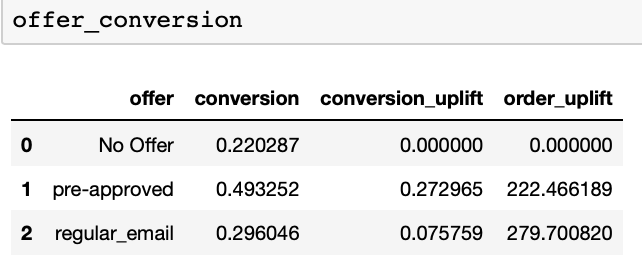
(3) Calculate how many incremental orders are created as a result of campaign offers (we assume each conversion represents one order in our data)
Order Uplift = Conversion Uplift multiply the number of customers in each test group
**(4) Lastly, if we assume our average order value to be $50, we can calculate the changes in revenue as a result of the campaign offers.
Revenue Uplift = Order Uplift multiply the average order value

**Let's summarize and highlight the above information in a plot:
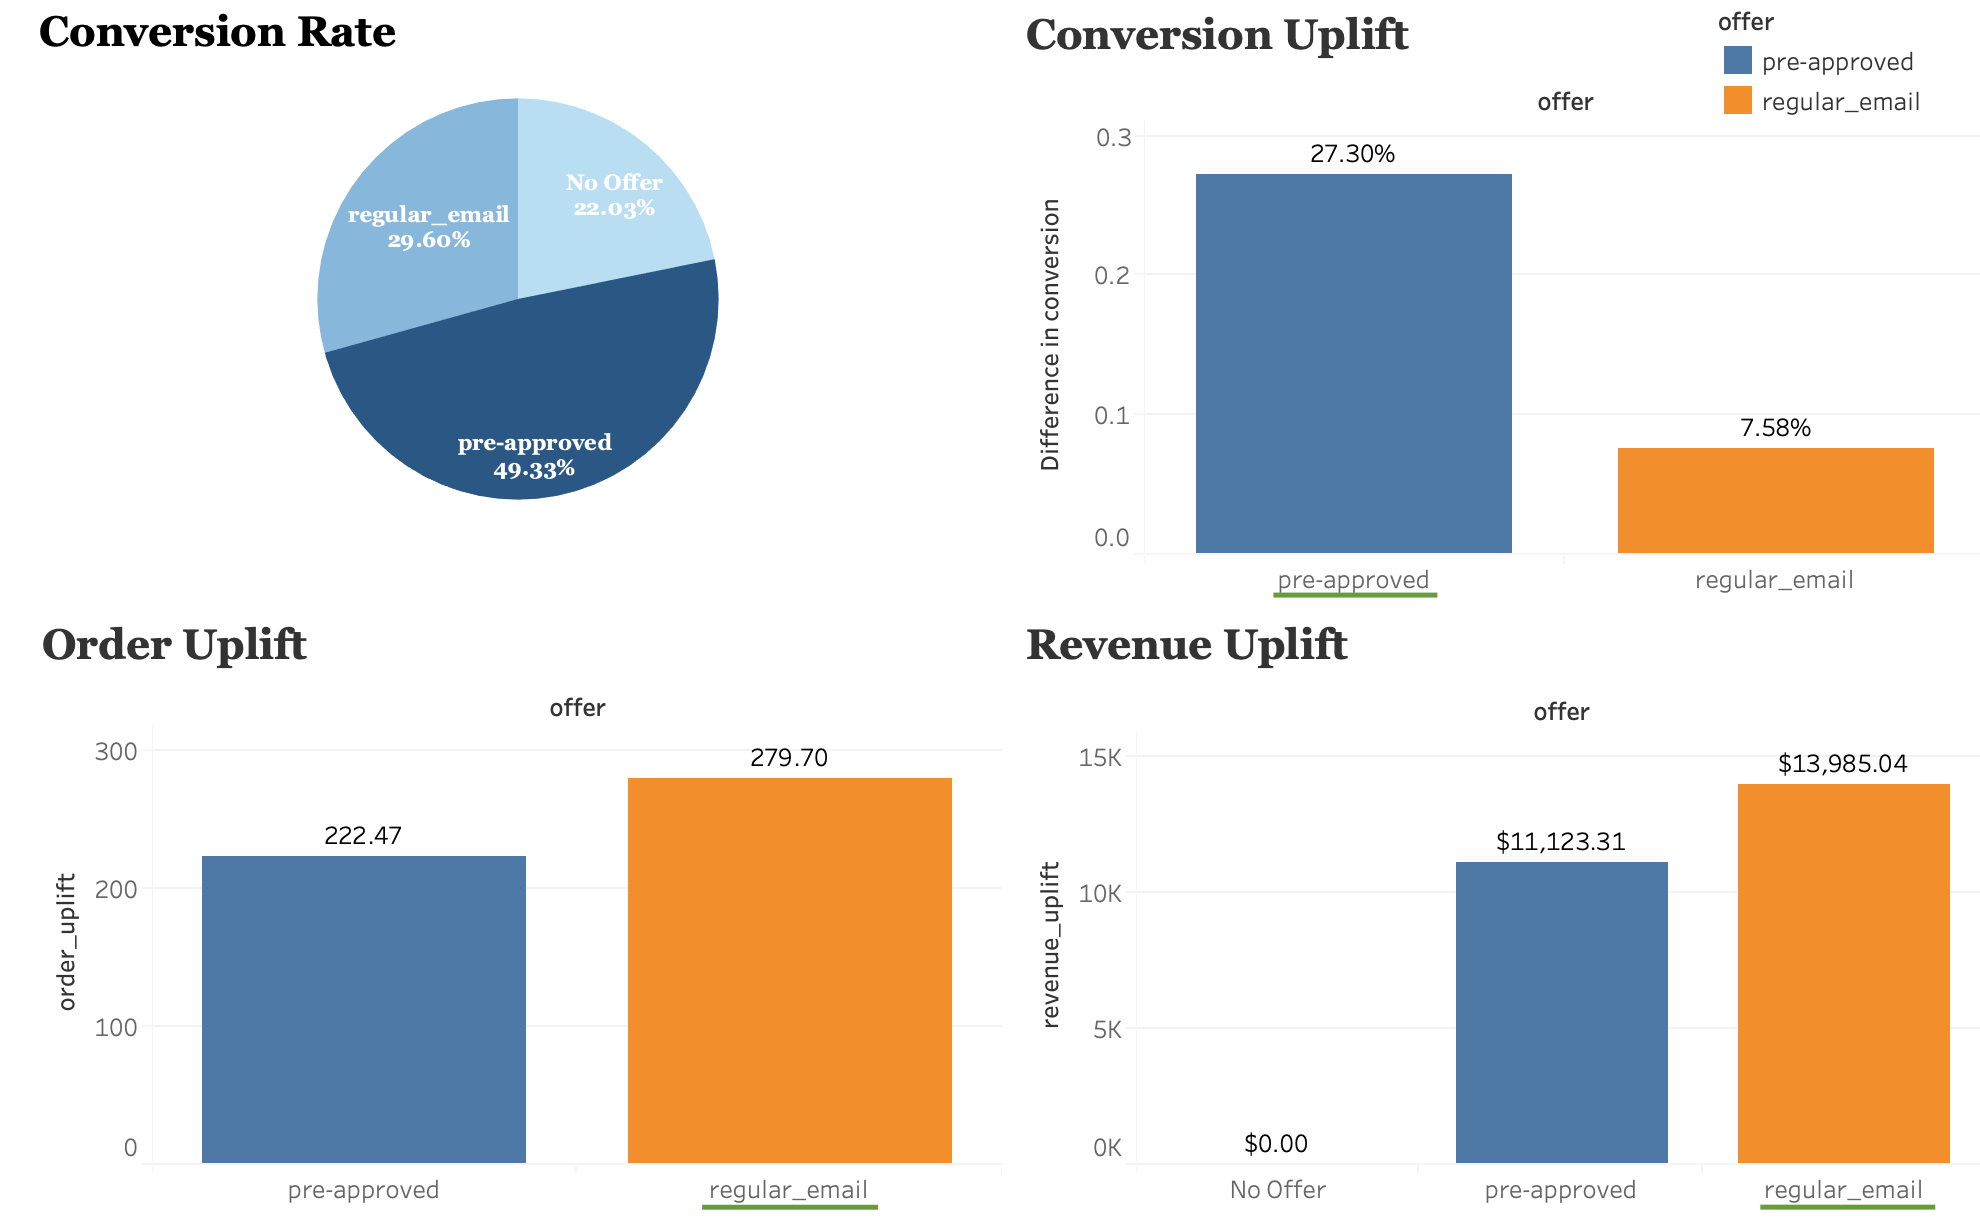
"Pre-approved" has the highest conversion rate. "Regular Email" contributes to most order uplifts and revenue lifts, this is because in our data, the majority of the offers we send out are regular emails and it has a relatively larger base.
| Offer Type | Number of Issued |
|---|---|
| No Offer | 976 |
| Pre-approved | 815 |
| Regular email | 3692 |
More findings:
**We can also look into other features and analyze their relationship with the label "conversion". There is a lot more to discover depending on our interests and business needs.
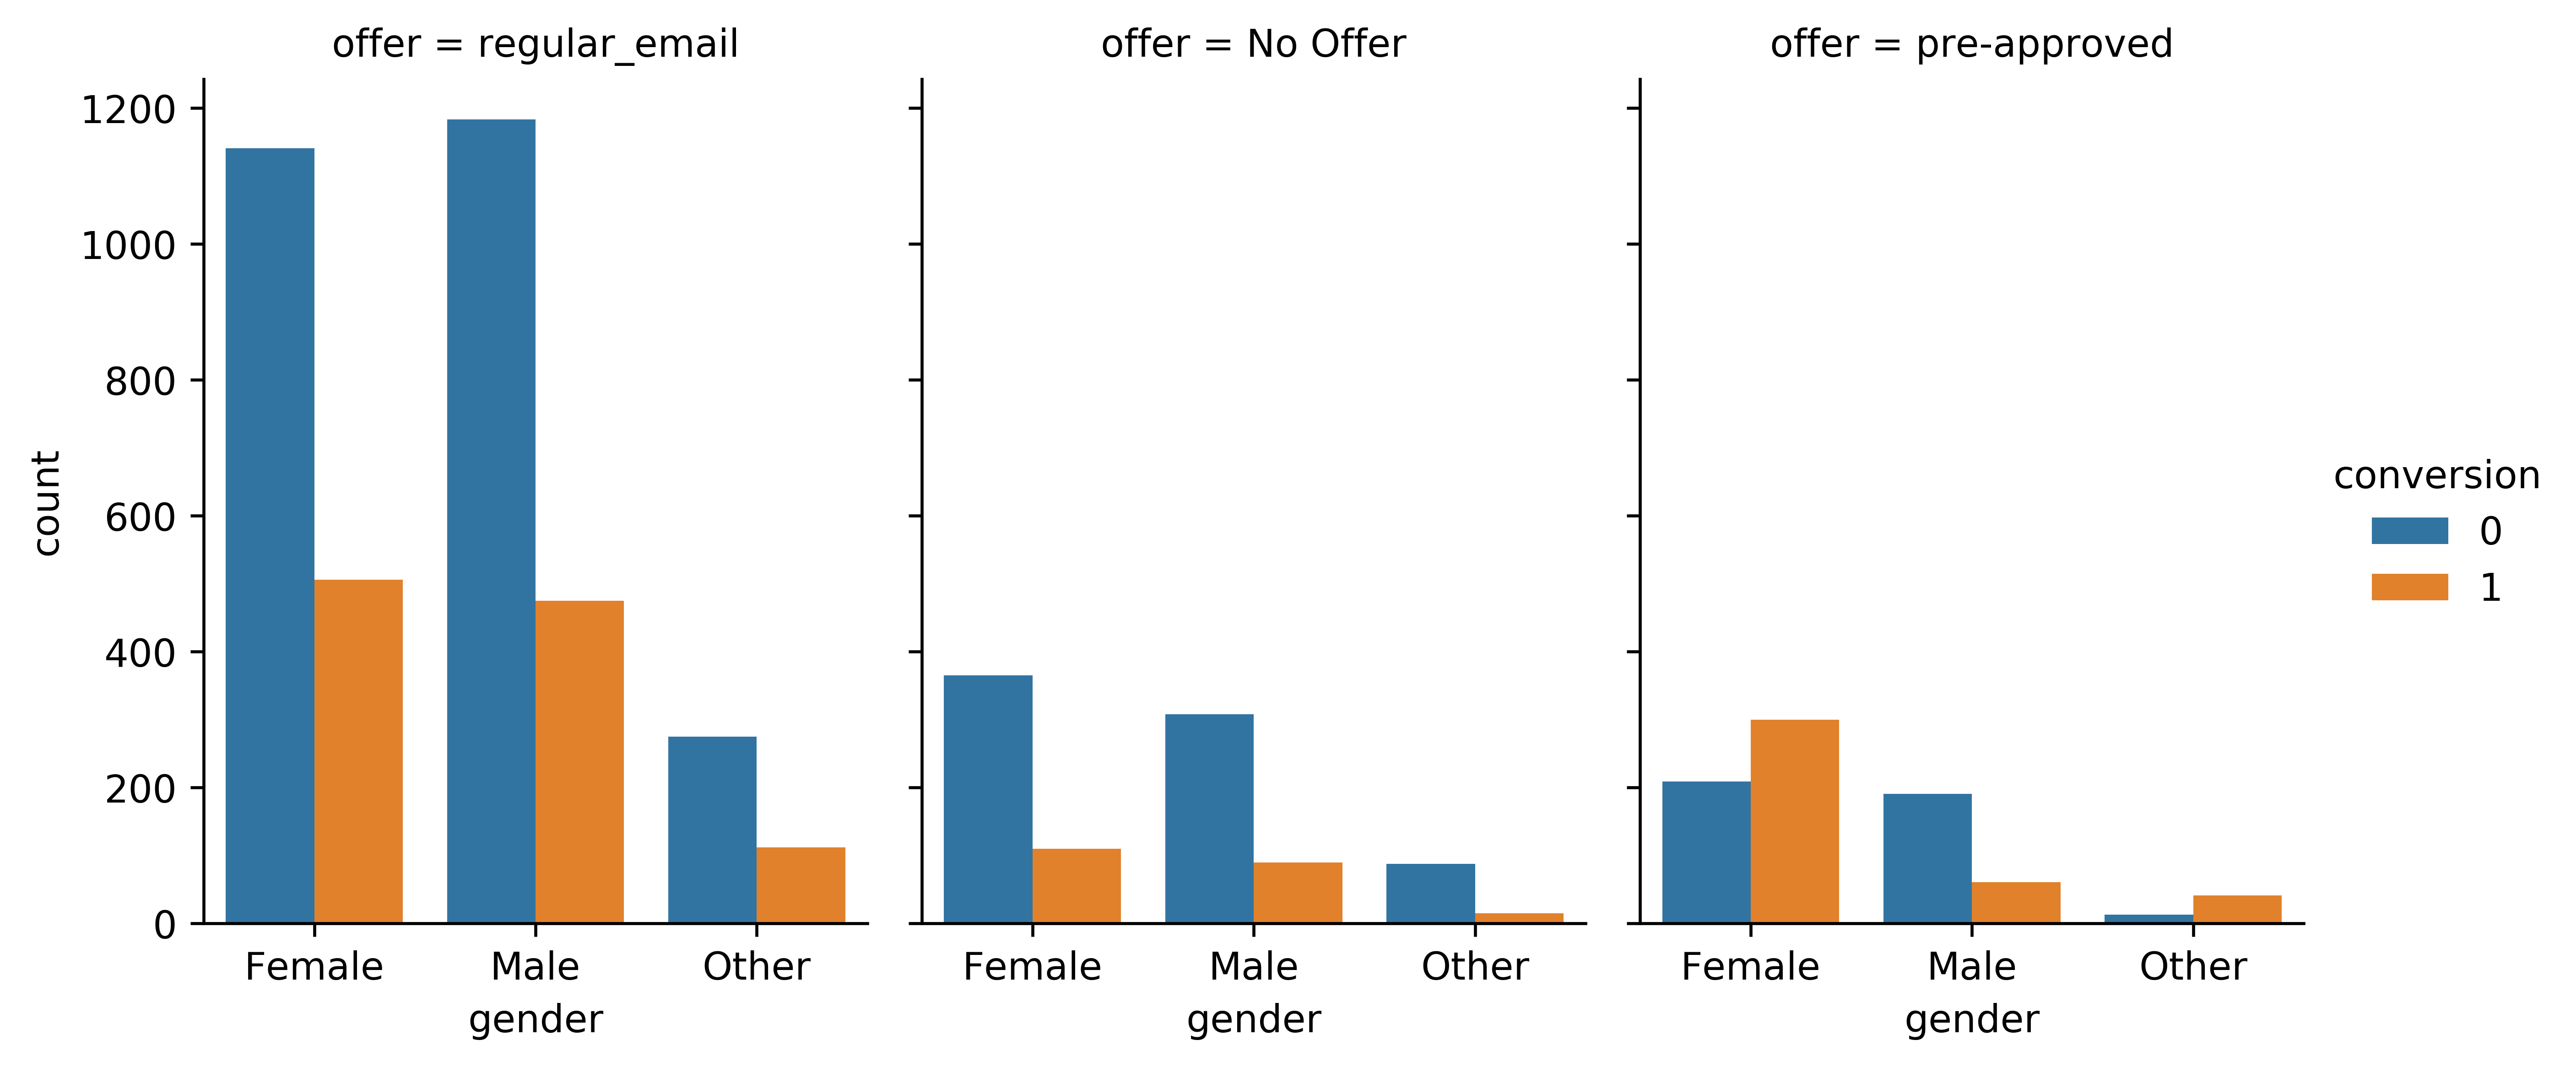
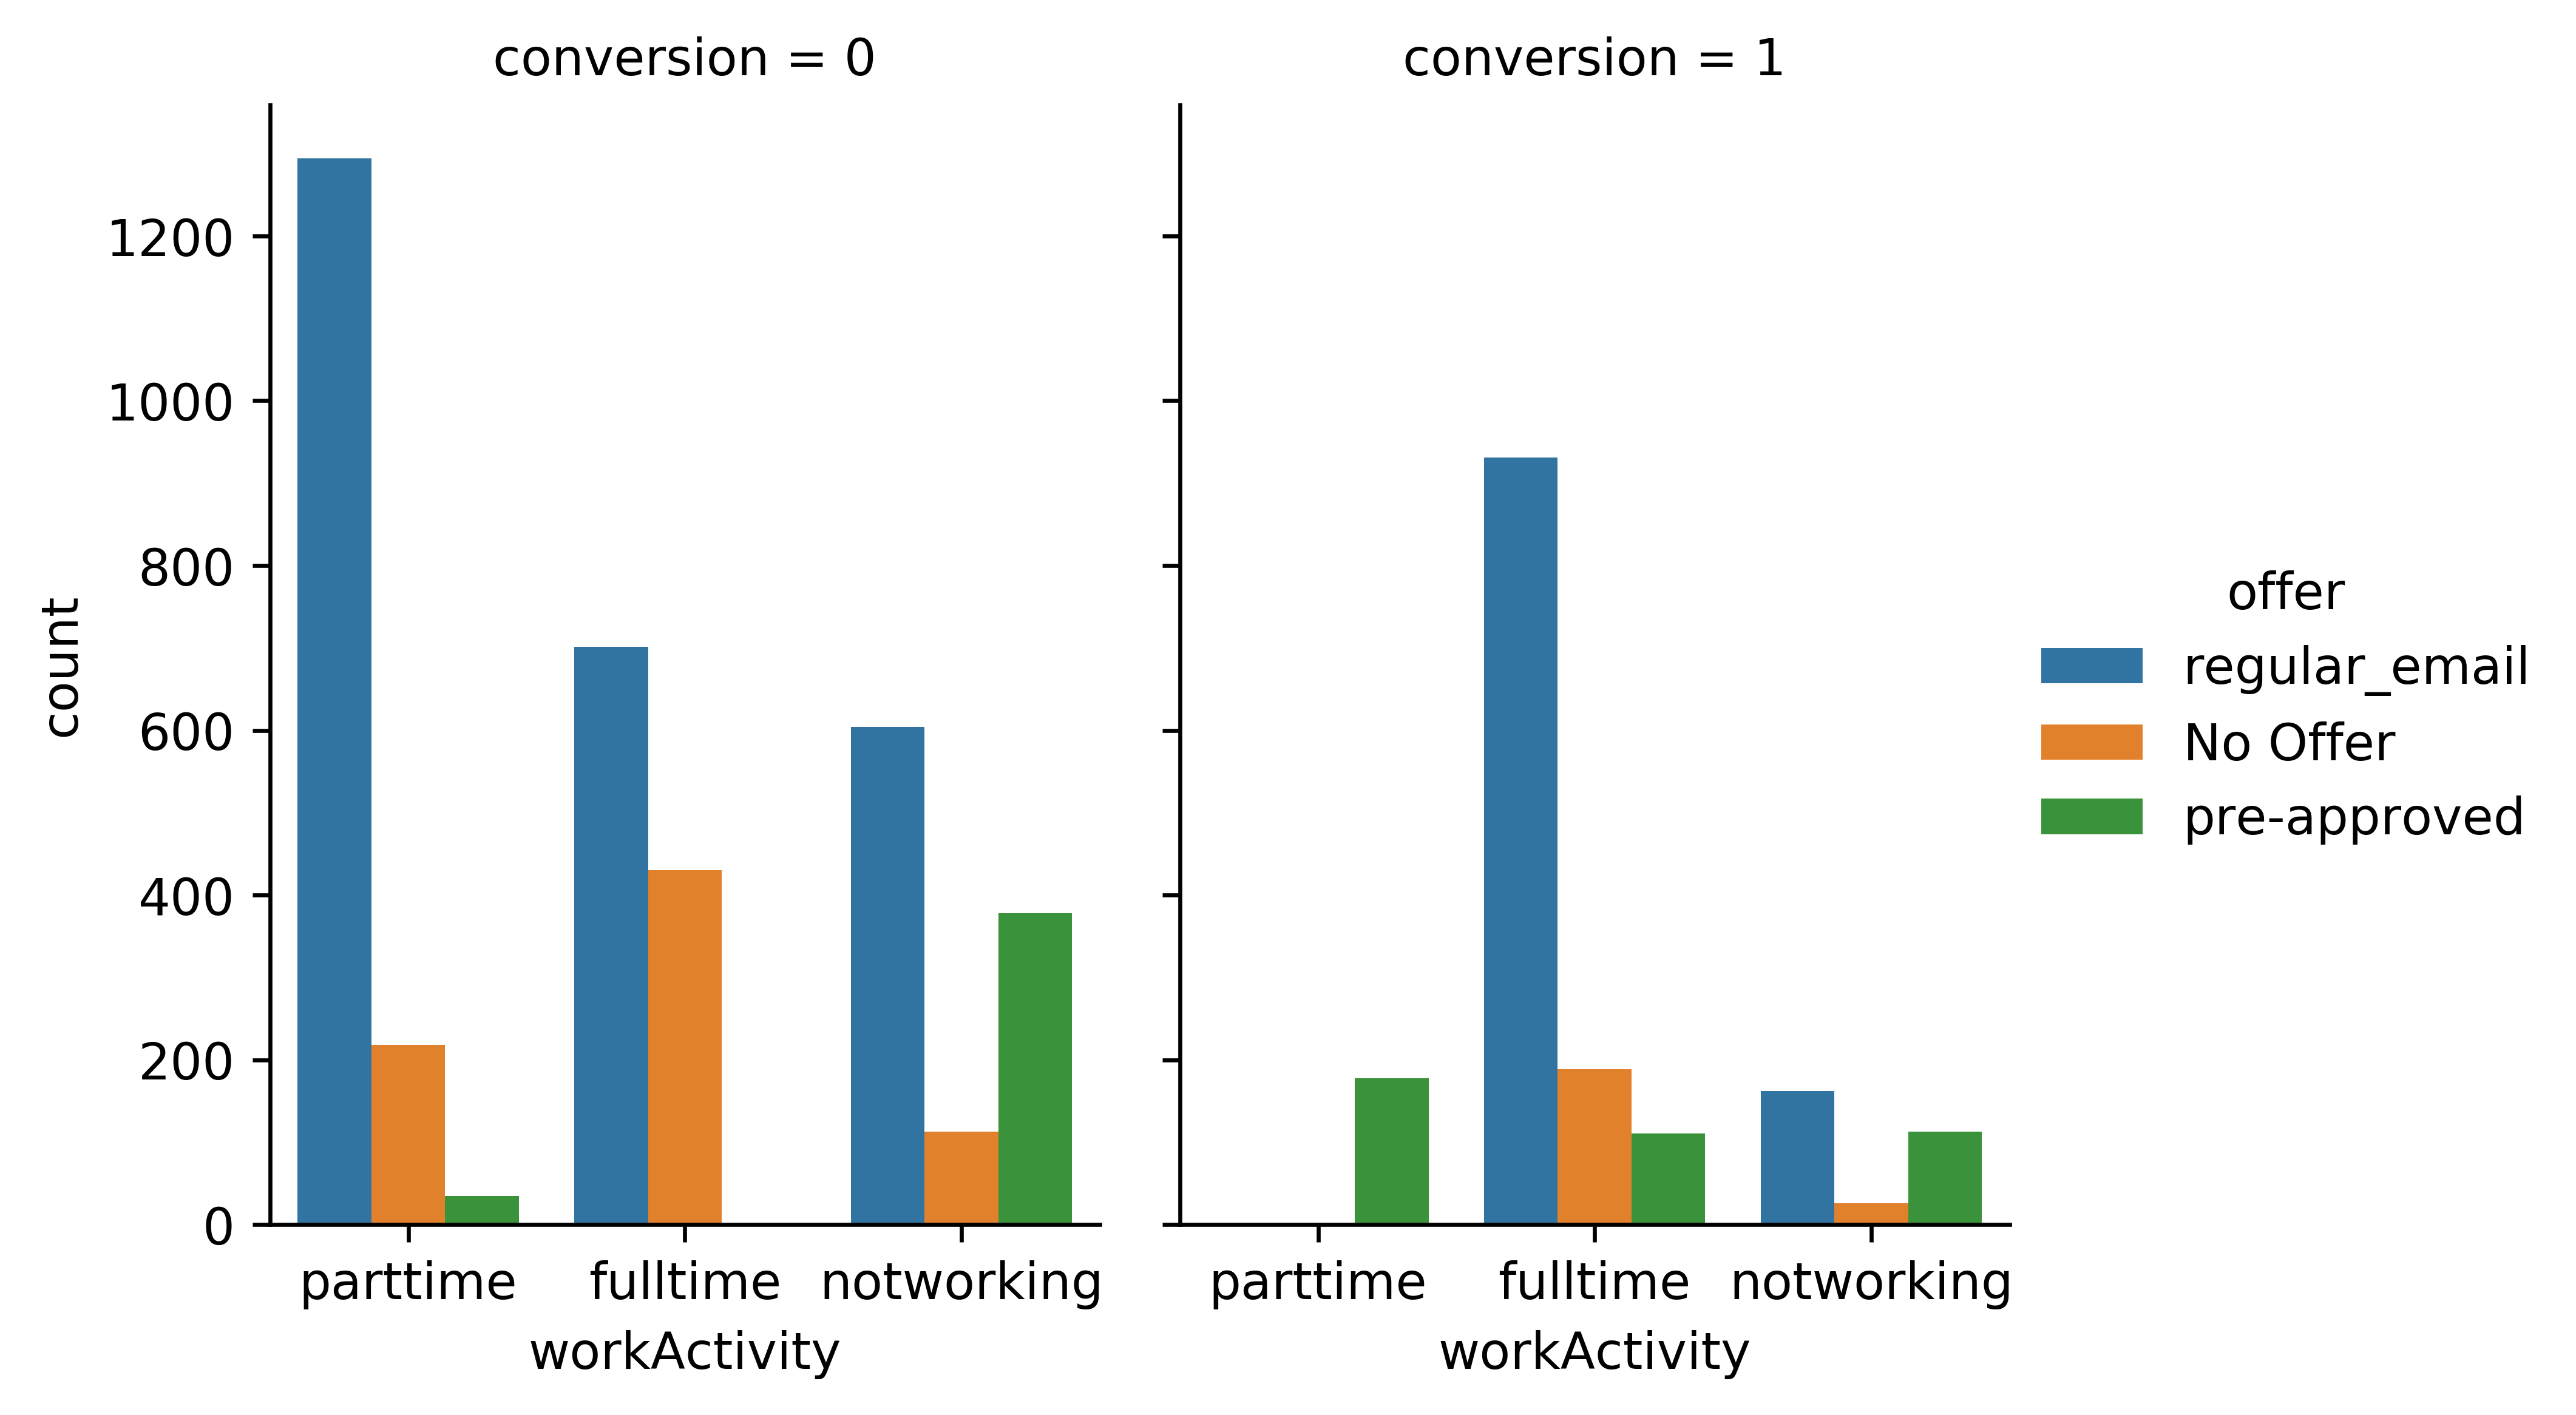
For example, we can find out which gender has the most conversions or does the customer who has a full-time job ("workActivity") has a higher probability of accepting our credit card offer?
Example 1: Gender and Conversion
Example 2: Work Activity and Conversion
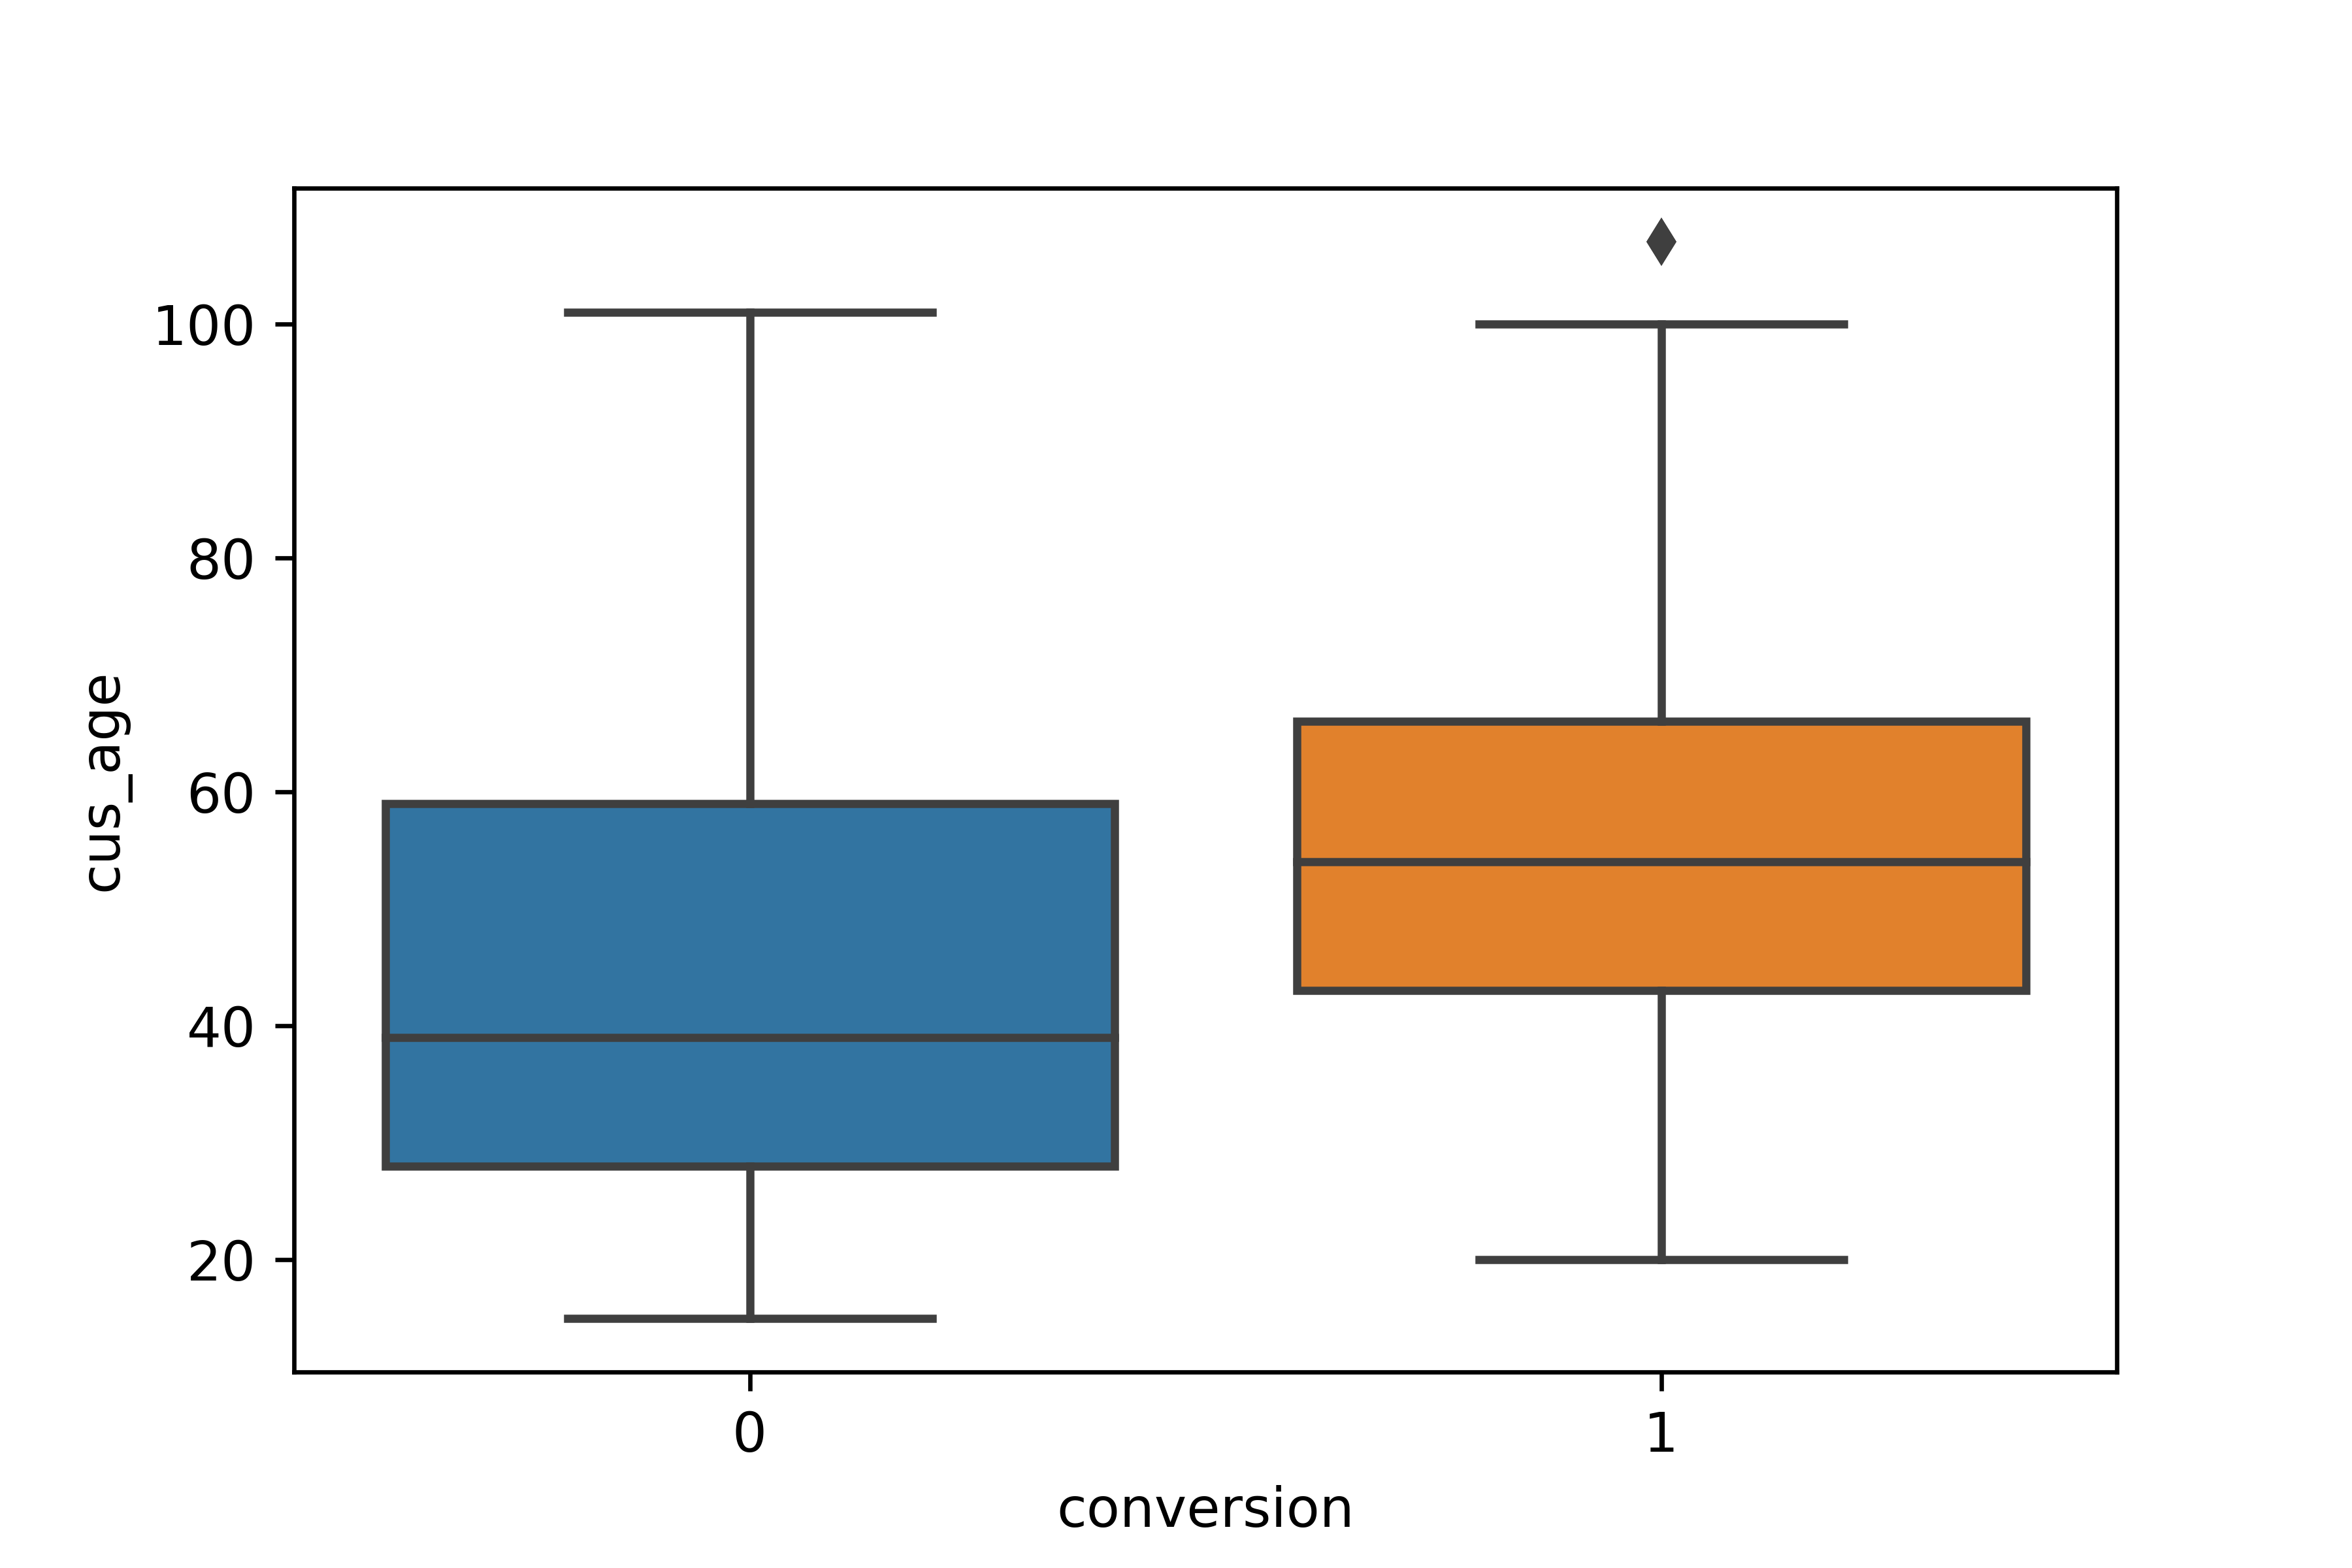
Example 3: Age and Conversion (age is calculated from the customer's age)
Machine Learning
The second objective for this demo is to build a predictive model to calculate the probabiliy of a customer to take the campaign offer.
Feature Selection & Engineering
Among all features I have available, I decided to drop "Recency", "Frequency" and "TotalSpend" because we previously used these three features to build our segmentation model. Besides, I'm keeping "RFM_Cluster" here which works as a compression form of these three so I don't need them again.

Now, since some of our features are categorical, hence we need to encode them before feeding them to the algorithm.
With one-hot encoding technique, we end up getting 270 columns.
model_mkt = pd.get_dummies(model_mkt)Create Training and Testing Data

Model Building & Parameter Search
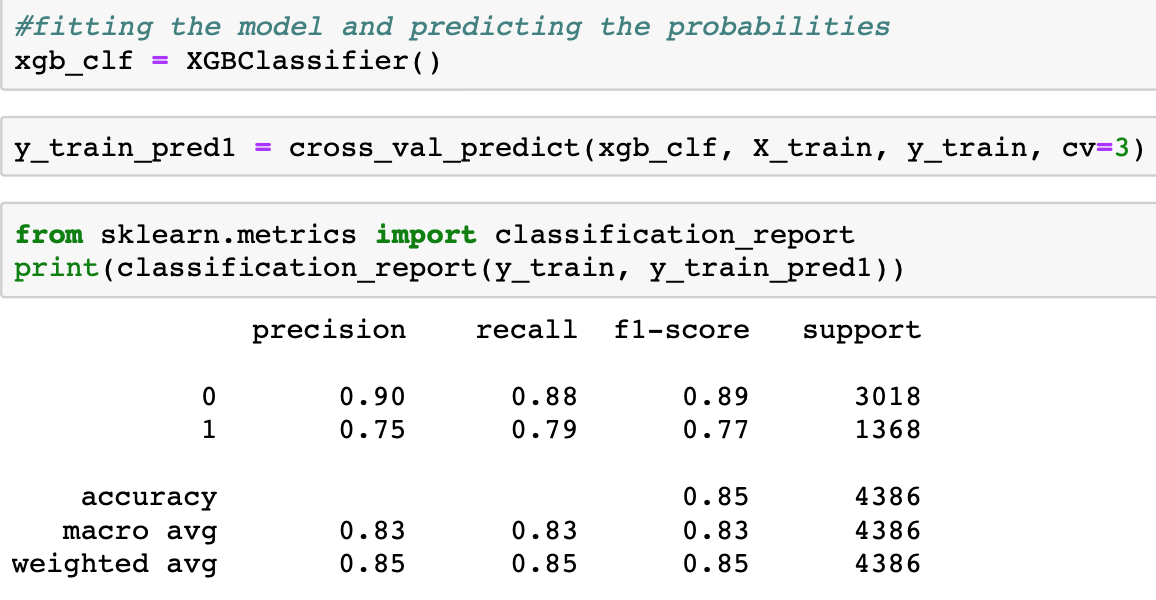
**Baseline Model:
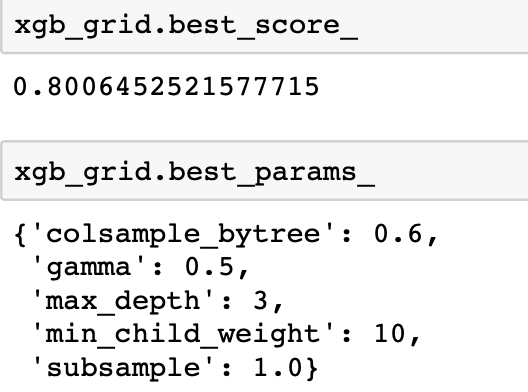
**Hyperparameter Search Result:
Our best parameter combination gives us an F1 score of 0.8, which is slightly better than our baseline model which gives 0.76. The result is acceptable and we can move further to the next step. (More details about this modelling section is available upon request)

**Let's apply on our test set:
When we apply the trained model to the test set, we use the "predict_proba" function to give us access to the conversion probability.
In another word, this gives us the probability of a customer to accept an offer.

We can also add the true label which is y_test to X_test, so we can measure the performance of our model.
Performance Evaluation
Here is how I plan to evaluate the performance of our model:
For each offer type (No Offer, pre-approved and regular email), calculate its average predict conversion rate and compare it with the true conversion rate in this offer type.
Code example:
X_test[X_test['offer_pre-approved']==1].groupby(['offer_pre-approved'])['real_conversion'].mean()
X_test[X_test['offer_pre-approved']==1].groupby(['offer_pre-approved'])['predict_conversion'].mean()
Results:
| Offer Type | Conversion Rate (True) | Conversion Rate (Predict) |
|---|---|---|
| No Offer | 0.27 | 0.226661 |
| Pre-approved | 0.522581 | 0.500631 |
| Regular email | 0.278976 | 0.289475 |
Findings: The predicted conversion rate for each offer type is close to the real conversion rate for each offer type.
Specifically, our model is slightly optimistic about the regular email offer, and pessimistic with "No Offer", and "Pre-approved" offer types.
The largest gap is found in "No Offer" type, and we should spend some time to improve the model ability to predict "No Offer" offer type.
Summary and Future Work
This marks the end of the post. In this post, I walked you through how to evaluate the effectiveness of marketing campaigns via various data analysis and visualization techniques. I also showed how to build a predictive model to predict whether a customer will take an offer.
In part II of the "Post-Campaign Analysis Use-Case Demo", I will demonstrate how to build a model to calculate each customer's marketing worth, so we can pinpoint exactly who to target with the offers from each segment group.
Think about this, you segment your customers to different value groups, and you designed specific product offers to different segments. Most of the time, you still don't want to target everyone in a segment to save on costs. There is always a non-responder type of customers, and you offer will not help much in their decision-making process.
